Học viện
Học viện

Giao dịch mùa báo cáo lợi nhuận tại Mỹ

Mùa công bố kết quả kinh doanh Q1 2026 có thể khiến thị trường biến động nhanh. Theo dõi lịch công bố sắp tới, lập danh sách theo dõi và giao dịch CFD cổ phiếu Mỹ với các công cụ dành cho nhà giao dịch năng động.

Most watched this season

Apple • Microsoft • Alphabet • Amazon • Nvidia • Meta • Tesla

Giao dịch mùa báo cáo lợi nhuận tại Mỹ với GO Markets

Mùa báo cáo lợi nhuận tại Mỹ mang đến làn sóng cập nhật lợi nhuận từ các công ty lớn niêm yết tại Mỹ. Kết quả, định hướng và kỳ vọng thị trường có thể thay đổi nhanh chóng, thúc đẩy biến động trên từng cổ phiếu, các ngành và các chỉ số rộng hơn.

Mức giá cạnh tranh

Kiểm soát chi phí khi giao dịch quanh các báo cáo biến động nhanh.

Công cụ phân tích kỹ thuật

Sử dụng biểu đồ và chỉ báo để lên kế hoạch điểm vào, điểm thoát và quản trị rủi ro.

Tối ưu cho giao dịch năng động

Giao dịch với khớp lệnh nhanh và nền tảng ổn định.

Công cụ quản lý rủi ro

Sử dụng các công cụ tích hợp để xác định mức rủi ro giảm và bảo vệ vị thế trong giai đoạn biến động.

Thêm thời gian để hành động

Có sẵn phiên giao dịch mở rộng cho một số CFD cổ phiếu Mỹ, cho bạn thêm thời gian giao dịch ngoài giờ chuẩn của thị trường.*

*Tùy theo từng sản phẩm. Điều kiện giao dịch có thể khác ngoài giờ thị trường thông thường.

Được theo dõi nhiều nhất mùa này

Lịch báo cáo lợi nhuận Mỹ

Thời gian hiển thị theo Giờ chuẩn Đông Úc (GMT+10). Bạn có thể đổi múi giờ bất cứ lúc nào trong phần cài đặt Lịch báo cáo lợi nhuận.

Tin tức & phân tích

US Earnings
AI
Defence, disruption and big finance: 3 names worth watching this earnings season

So here is the thing: April’s US earnings season is arriving in a market that still feels anything but normal. As GO Markets explains in The global US earnings playbook: The essential guide for traders, this reporting period is landing after a real shift in what markets care about. It is no longer just about chasing growth at any cost. It is about what the numbers are saying beneath the surface.

And in 2026, those signals are colliding with a high-friction backdrop:

  1. Geopolitical conflict: Ongoing tension in the Middle East
  2. Oil supply shock: Brent crude above US$100
  3. The Fed: A central bank still boxed in by sticky inflation

The durability pivot

Yes, AI is still the market’s main story but it's still the flashy engine getting most of the attention. But underneath that, there is a quieter move towards companies that look built to hold up better when conditions get harder.

When rates are uncertain and energy markets are under pressure, names like JPMorgan Chase and the major defence contractors start to carry more weight. They are not replacing the AI narrative, rather, they are becoming part of the way traders read risk appetite, earnings durability and, ultimately, where the market is looking for something more solid to hold on to.

! Important: Reporting schedules can change without notice. Reporting dates and release times are from company investor relations calendars where marked Confirmed; otherwise they are GO Markets estimates. Consensus EPS, revenue and analyst-range data are from third-party market consensus sources, as of 7 April 2026 (AEDT). Company guidance, backlog and operating metrics are from the latest company filings or results presentations unless stated otherwise. Figures and schedules may change without notice.
$JPM | Q1 2026 REPORTING PERIOD

JPMorgan Chase & Co.

NYSE | Financial Services | 14 Apr 2026
Confirmed

Global Release Countdown (BMO)

00:00:00:00
Consensus EPS
US$5.42
Consensus Revenue
US$47.88bn
AU/ASIA 14 Apr | 8:45 pm
US/LATAM 14 Apr | 6:45 am
Market Intelligence: $JPM

Analysis: JPM price drivers and scenarios

NII guidance
~US$103 billion
Full year | US$95 billionn ex:markets
ROTCE target
17%
Possible return on tangible common equity
Analyst range
US$5.02-5.70
Low to high estimate spread
AVG
LOW US$5.02 AVG US$5.39 HIGH US$5.70

The analyst spread of US$0.68 signals genuine disagreement about how the rate environment is flowing through to margins. A result above consensus but below the high end estimate may produce a muted reaction. A result above US$5.70 may shift the discussion.

Key swing factors for the result

Net interest income (NII)
The clearest macro lever. It reflects the gap between lending rates and deposit costs.
Guidance: US$103 billion for the full year
Return on tangible common equity (ROTCE)
A scale check. It indicates whether JPM is converting scale into efficiency. 17% is the benchmark.
Target: 17% ROTCE
Trading and investment banking
Strong Q1 growth was expected in fees and markets revenue. These lines can offset softness in lending, and stronger-than-expected performance here may shift the narrative away from rate sensitivity.
Watch: investment banking (IB) fees versus the prior quarter
Expense discipline
A bank can beat the EPS estimate and still sell off if expense growth is running too hot. Pairing the EPS result with the expense trajectory gives a fuller read on whether the beat is durable.
Watch: Expense outlook commentary
Trade Execution: $JPM

Earnings reaction framework: Q1 2026

Bull case
EPS above US$5.70, NII on track | ROTCE at or above 17%
The result comes in above the top of the analyst range. NII guidance holds or is revised higher. IB fees and markets revenue show strong Q1 growth. Expense commentary is constructive.
Possible reaction: momentum and repositioning
Base case
EPS between US$5.39 and US$5.70, NII in line | ROTCE near target
The result beats consensus but stays within the expected range. NII tracks guidance. The tone of the conference call may matter more than the headline number. The first move may fade if guidance is unchanged.
Possible reaction: muted or mixed initial response
Bear case
EPS below US$5.39 | NII misses | Expense growth surprises
The result comes in at or below the consensus midpoint. NII guidance is cut or qualified. Expense growth comes in above market expectations. IB or markets revenue disappoints.
Possible reaction: earnings multiple repricing

Reaction trigger to watch: The market response in the first 30 minutes after the result may indicate which scenario traders are leaning towards. A move above the prior session high on volume may support the bull case. A fade back into the range after an initial pop may point to the base case. A break below the prior session low on volume may suggest the bear case is gaining traction.

Sentiment Analysis · JPMorgan Chase

Interactive scenario analysis: $JPM

Select earnings outcome
Growth momentum

AI-linked offset, beat supported by NII and ROTCE

Stronger-than-expected demand for AI-related industrial lending may offset softer mortgage activity. Management maintains guidance as NII remains resilient in higher-for-longer conditions. IB fees and markets revenue may provide additional support. ROTCE at or above 17% would suggest the bank is converting scale into earnings efficiently.
EPS Outcome
Above US$5.70
NII Signal
On track
ROTCE
At or above 17%
Likely Reaction
Momentum may build

Sources & Data Methodology Sources: Reporting dates and release times are from company investor relations calendars where marked Confirmed; otherwise they are GO Markets estimates. Consensus EPS, revenue and analyst-range data are sourced from Bloomberg and Earnings Whispers, as at 7 April 2026 (AEDT). Company guidance, backlog and operating metrics are sourced from the latest company filings, results presentations or investor relations materials unless stated otherwise. Any scenario analysis reflects GO Markets analysis. Figures and schedules may change without notice.

From credit to defence

If JPMorgan gives the market an early read on the consumer, credit quality and business activity, the defence names may be telling a different story. This is the point where the focus may start to shift from the credit cycle to government-backed demand.

In a market still shaped by geopolitical risk, that matters. Long-dated programs can help support revenue visibility, even when the broader outlook looks less certain. That is one reason the sector remains on the watchlist.

$LMT | Q1 2026 REPORTING PERIOD

Lockheed Martin Corp.

NYSE | Aerospace | Defense | 23 Apr 2026
Confirmed

Global Release Countdown (BMO)

00:00:00:00
Consensus EPS
US$6.50
Consensus Revenue
US$16.32bn
AU | ASIA 23 Apr | 9:20 pm
US | LATAM 23 Apr | 7:20 am
Market Intelligence: $LMT

Analysis: LMT price drivers and scenarios

Order backlog
US$194 billionn
Record visibility
Book-to-bill
1.2x
Orders outpacing sales
Analyst range
US$6.90-7.10
Low to high estimate spread
AVG
LOW ~US$6.90 AVG ~US$6.94 HIGH US$7.10+

The consensus sits near the lower end of the analyst range. That positioning may leave room for upside if backlog growth and F-35 delivery timelines support execution. A print near the high end, above US$7.10, may extend the move, although the reaction would still depend on guidance and margins.

Key swing factors for the result

Backlog visibility
Primary evidence of demand. Book-to-bill above 1.2x would support full-year guidance and the production ramp.
Backlog: US$194 billion record
Free cash flow (FCF)
Defence stocks are often assessed on cash conversion. The market may look for confirmation of the US$6.5 billion floor.
Guide: US$6.5 billion - $6.8 billion
Missile segment growth
PrSM and THAAD deliveries remain key watchpoints. Strong space margins may help offset softness in aeronautics.
Watch: Fire Control margins
Margin pressure
Pension charges and production inflation remain risks. An earnings beat may fade if operating margins contract.
Watch: segment operating margin
Trade Execution: $LMT

Earnings reaction framework: Q1 2026

Bull case
EPS above US$6.70, backlog visibility confirmed | FCF guide holds
The result clears the upper half of the analyst range. Management reaffirms or raises the full-year FCF outlook. Strong Missiles and Fire Control (MFC) margins help offset any aeronautics supply chain lag.
Possible reaction: momentum may build and positioning may improve
Base case
EPS between US$6.30 and US$6.70 | Backlog steady at about US$194 billion
The result aligns with the US$6.38 consensus. F-35 delivery pace remains on track but offers no meaningful upside surprise. The market may wait for more specific segment guidance on the conference call.
Possible reaction: muted or mixed initial response
Bear case
EPS below US$6.30 | FCF guide qualified, margin contraction
The result falls towards the bottom of the analyst spread. Management cites further software delays or program losses. The FCF trajectory narrows towards the lower end of previous expectations.
Possible reaction: the share price may come under pressure

Reaction trigger to watch: The market response in the first 30 minutes after the result may indicate which scenario traders are leaning towards. A move above the prior session high on volume may support the bull case. A fade back into the range after an initial pop may point to the base case. A break below the prior session low on volume may suggest the bear case is gaining traction.

Sentiment Analysis · Lockheed Martin

Interactive scenario analysis: $LMT

Select earnings outcome
Backlog confirmed

Backlog and FCF confirmation may support continuation

EPS clears the top of the analyst range. Backlog holds at or above US$194 billion and book-to-bill stays above 1.2, which would suggest orders are replenishing faster than revenue is being recognised. FCF guidance holds within the stated range.
EPS outcome
Above US$7.00
Backlog signal
Above US$194 billion
FCF guide
Holds or improves
Likely reaction
Continuation may follow

Sources & Data Methodology Sources: Reporting dates and release times are from company investor relations calendars where marked Confirmed; otherwise they are GO Markets estimates. Consensus EPS, revenue and analyst-range data are sourced from Bloomberg and Earnings Whispers, as at 7 April 2026 (AEDT). Company guidance, backlog and operating metrics are sourced from the latest company filings, results presentations or investor relations materials unless stated otherwise. Any scenario analysis reflects GO Markets analysis. Figures and schedules may change without notice.

Not all defence names are the same

Lockheed Martin and Northrop Grumman may sit in the same defence bucket, but the market does not always read them the same way. Lockheed is more closely tied to the F-35 and current air combat demand. Northrop is more closely linked to next-generation programs such as the B-21 Raider and Sentinel.

That gives this section its contrast. One is often read through the lens of current defence demand. The other is more closely tied to longer-cycle strategic modernisation.

$NOC | Q1 2026 REPORTING PERIOD

Northrop Grumman Corp.

NYSE | Defense | Space Systems | 21 Apr 2026
Confirmed

Global Release Countdown (BMO)

00:00:00:00
Consensus EPS
US$6.12
Consensus Revenue
US$10.24 bn
AU | ASIA 21 Apr | 10:30 pm
US | LATAM 21 Apr | 8:30 am
Market Intelligence: $NOC

Analysis: NOC price drivers and scenarios

Consensus EPS
US$6.96
Quarterly analyst average
Order Backlog
US$95.7 billion
Record revenue visibility
FY 2026 EPS guide
US$27.40-US$27.90
Full-year 2026 outlook
AVG
LOW ~US$6.90 AVG ~US$6.96 HIGH US$7.20+

The consensus sits near the lower end of the analyst range. That offers a quick visual for whether the result is merely in line or strong enough to ease the guidance concerns that weighed on the stock after its last update. A result above US$7.20 may shift the conversation more materially.

Key swing factors for the result

Book-to-bill ratio
Currently at 1.10, suggesting orders are still running ahead of revenue recognition. This remains an important signal for multi-year growth visibility in defence.
Watch: 1.10 target
Guidance reset risk
Management’s guidance previously came in below market expectations. The market may be sensitive to any further softening in the 2026 outlook.
Watch: guidance commentary
Program concentration
The B-21 Raider and Sentinel carry outsized execution sensitivity. Updates on production ramp and funding may be the clearest drivers of sentiment for the stock.
Watch: B-21 and Sentinel updates
Capacity investment
Higher capital expenditure (capex) supports the industrial base over the longer term, but it may pressure near-term margins. Watch for signs that current investment is weighing on earnings power.
Watch: operating margins
Trade Execution: $NOC

Earnings reaction framework: Q1 2026

Bull case
EPS above US$6.30, backlog expansion above US$96 billion | Free cash flow (FCF) guidance raised
The result comes in above the cited threshold. Management says B-21 Raider production is ahead of schedule, with improving margins. Sentinel program restructuring costs remain below baseline expectations. International awards lift the book-to-bill ratio above 1.15.
Possible reaction: momentum may improve
Base case
EPS between US$6.00 and US$6.20, backlog steady at about US$95.7 billion
The result is broadly in line with the cited range. FCF targets for 2026 are reaffirmed but not expanded. Market focus shifts to organic sales growth metrics and segment operating margins. The initial reaction may depend on the timing of B-21 milestone payments.
Possible reaction: little reaction
Bear case
EPS below US$5.95 | margin pressure, guidance narrowed
The result lands near the low end of the analyst spread. Management flags higher infrastructure costs for Sentinel or delays in restricted space segment awards. Margin pressure in Aeronautics persists, and the 2026 revenue guide narrows towards the US$43.5 billion floor.
Possible reaction: shares may weaken

Reaction trigger to watch: The market response in the first 30 minutes after the result may indicate which scenario traders are leaning towards. A move above the prior session high on volume may support the bull case. A fade back into the range after an initial pop may point to the base case. A break below the prior session low on volume may suggest the bear case is gaining traction.

Sentiment Analysis · Northrop Grumman

Interactive scenario analysis: $NOC

Select earnings outcome
Stealth momentum

B-21 momentum, stronger execution and FCF support

EPS clears US$6.15. Management confirms a production capacity agreement for the B-21 Raider. Sentinel restructuring reaches Milestone B on schedule. Record backlog visibility and higher FCF guidance towards US$3.5 billion may support broader repositioning.
EPS outcome
Above US$6.15
B-21 Signal
Acceleration
FCF guide
$3.5 billionn range
Likely reaction
Momentum rally

Sources & Data Methodology Sources: Reporting dates and release times are from company investor relations calendars where marked Confirmed; otherwise they are GO Markets estimates. Consensus EPS, revenue and analyst-range data are sourced from Bloomberg and Earnings Whispers, as at 7 April 2026 (AEDT). Company guidance, backlog and operating metrics are sourced from the latest company filings, results presentations or investor relations materials unless stated otherwise. Any scenario analysis reflects GO Markets analysis. Figures and schedules may change without notice.

Bottom line

In a market shaped by geopolitical risk and shifting rate expectations, companies with visible demand and longer-cycle revenue may continue to attract attention. But sentiment can still turn quickly if valuations are stretched, rate expectations shift again, or tensions in the Middle East ease.

That is why the story still needs to be tested against the numbers, not just the narrative. GO Markets will be analysing more companies throughout this earnings season. For more updates, visit our earnings page, follow our social media channels, or check the weekly newsletters.

Your next earnings setup starts here

Stay ahead of major beats, misses, and market surprises. Log in to your terminal, open a new account, or explore our dedicated earnings academy.

Need help? Contact our support team

GO Markets
April 7, 2026
US Earnings
Shares
The global US earnings playbook: The essential guide for traders

If you have been watching markets over the past year, you will have noticed that the "growth at any cost" era has effectively hit a wall. The April 2026 earnings cycle arrives at a moment when the market's focus has undergone a structural reorientation. It is not just about profit and loss statements anymore. It is about the signals sitting behind them.

With interest rate uncertainty lingering and geopolitical shocks pushing oil above US$100, the playbook has shifted from AI hype toward institutional resilience and the industrialisation of compute. For traders in Australia, Asia and Latin America, these results may act as a mood ring for global risk appetite and the emerging security supercycle.

Important - Dates, Times and Figures

All earnings dates marked as confirmed or estimated should be verified against current company investor relations calendars before you act on them. Reporting schedules can change without notice due to corporate decisions, regulatory requirements or exchange timetable adjustments.

The mechanics: How the timing works across time zones

The US earnings season does not arrive as a smooth drip. It arrives in waves. For non-US traders, the primary challenge is the overnight gap: major results land while you are away from your desk and can move index CFDs before your local market opens. Before market open (BMO) and after market close (AMC) matter just as much as the numbers themselves. The timing changes how quickly markets react, when liquidity is available and whether the first move has already happened before your session begins.

Why BMO and AMC matter

A BMO result hits before the US cash market opens, so price discovery happens in pre-market trading where liquidity is thinner and moves can be exaggerated. An AMC result hits after close, meaning the reaction is compressed into a short pre-market window the following morning. Understanding which window your company reports in is as important as understanding what it reports.

Institutional Grade Performance

Master the Markets with MetaTrader 5

Trade hundreds of instruments with superior speed and advanced technical analysis. Harness full EA functionality to execute your strategy.

Need to access your terminal? Log in to Client Portal

The key themes for Q1

For this cycle, the market is no longer rewarding AI mentions alone. It is looking for return on investment (ROI) proof. The four thematic snapshots below help explain where attention is likely to sit as results come through. Each theme has its own section with company cards that can be updated each quarter.

T1
Theme 1 — Institutional anchors

Defence against volatility

These companies are often watched as relative defensives during energy shocks and inflation spikes, although they remain exposed to normal share-price risk. When macro uncertainty rises, money has historically rotated toward businesses with contracted revenue, government-linked demand or pricing power that is not dependent on the consumer cycle — but past rotation patterns do not guarantee future performance.

JPM
JPMorgan Chase
Tuesday, 14 April Confirmed
Watch For

Net interest margin (NIM) under higher for longer rates, and whether AI spending remains cost neutral.

LMT
Lockheed Martin
Wednesday, 22 April Estimated
Watch For

F-35 delivery schedules and the company's ability to absorb tariff related costs on supply chain inputs.

NOC
Northrop Grumman
Monday, 27 April Confirmed
Watch For

B-21 Raider production progress and the conversion of its reported US$95.7 billion backlog into recognised revenue.

T2
Theme 2 — Tangible capital

EVs and energy

As parts of tech slow, investors have been rotating toward tangible, capital-intensive businesses. The energy transition and the infrastructure required to support AI data centre power demand have put utilities and energy companies in an unusual position: they are now growth stocks with defensive characteristics — though all remain subject to ordinary equity and sector risk.

TSLA
Tesla
Thursday, 23 April Confirmed
Watch For

The strategic shift from EV margins toward robotaxi and energy storage as the new growth narrative.

NEE
NextEra Energy
Friday, 24 April Estimated
Watch For

Data centre power demand and progress on its reported 30 GW contracted backlog as utilities face new infrastructure pressure.

XOM
Exxon Mobil
Wednesday, 29 April Estimated
Watch For

Permian and Guyana volume growth, and cash flow resilience during the Hormuz supply disruption.

T3
Theme 3 — The hardware invoice phase

AI infrastructure

This is the engine room of the S&P 500 and the part of the market most tied to whether AI capital expenditure is generating measurable returns. The question the market is now asking is not whether these companies are spending on AI. It is whether the spending is translating into capacity utilisation and revenue that justifies the multiple.

MSFT / GOOGL
Microsoft and Alphabet
Monday, 27 April Estimated
Watch For

Azure and Cloud capacity constraints against heavy AI capital expenditure. The gap between spending and utilisation is the market's primary concern.

NVDA
NVIDIA
Wednesday, 27 May Estimated
Watch For

Blackwell GPU demand and gross margin sustainability as the product cycle matures and competition intensifies.

T4
Theme 4 — K-shaped recovery

Consumer platforms and devices

This theme tests the K-shaped consumer recovery: higher-income cohorts remain more resilient while lower-income cohorts face continued pressure from elevated borrowing costs and energy prices. Ad revenue and device upgrade cycles are the clearest indicators of where on the K-curve the consumer sits.

META / AMZN
Meta and Amazon
28 to 29 April Estimated
Watch For

AI-driven ad click improvements against Reality Labs spending and retail logistics costs as the profitability test for non-core investment.

AAPL
Apple
Thursday, 30 April Estimated
Watch For

iPhone upgrade cycle momentum and the Apple Intelligence rollout in China as the first real-world test of AI-driven hardware demand.

Analysis checklist: how to read each result

Use this structure for every company on your watchlist. A headline beat is common. The bigger market move often comes from how the market translates the details sitting behind the number.

1
Projected consensus

This is the bar for earnings per share (EPS) and revenue. Small beats may already be priced in. The market often sets a whisper number above the published consensus, so a technically positive result can still disappoint.

2
The call focus

Identify the single variable analysts are most focused on this cycle: capital expenditure versus margins, inventory turnover, customer growth rate, or contract backlog conversion.

3
The translation

A beat, meet or miss each carries a different market dynamic.

Beat Matters most when forward guidance is credible. Without it, the initial move may reverse.
Meet Often shifts focus to the tone of the call, particularly language around capacity or outlook.
Miss Can be treated as the start of a trend and trigger a sharp repricing of valuation multiples.

The recency bias problem

The emotional trap many traders fall into is recency bias. Because the Magnificent 7 have led markets for so long, it can feel as though they are still the only trade that matters. That assumption deserves to be tested.

It's worth asking: Is the obvious trade already priced for perfection?

2026 is shaping up as a year of proof. Companies that spent heavily on AI over the past two years are now being asked to show the return. The market is no longer rewarding the announcement of AI investment. It is rewarding the evidence of AI-driven revenue outcomes.

A better framing question for each result is this: are you reacting to a headline, or are you assessing the company's role in the physical AI supply chain or as a potential volatility hedge? Those are very different analytical tasks, and they tend to produce very different positioning decisions.

What to watch next

Three time horizons, three distinct signals. Update these each cycle with the most relevant near-term catalyst, the sector rotation to watch, and the longer-horizon dispersion theme.

Next Two Weeks
Consumer health barometer

Watch the 31 March Nike report as a lead indicator for consumer discretionary health. Footwear and apparel demand signals tend to front-run broader retail sentiment.

Next 30 Days
Bank lending and industrial demand

Focus shifts to the major banks. If loan demand tied to industrial and infrastructure projects remains firm, the earnings cycle may have support beyond the tech sector.

Next 60 Days
Wider dispersion between winners and losers

Watch for dispersion to widen. The companies converting heavy capital expenditure into measurable revenue outcomes may separate clearly from those that cannot.

Client & Education Portal

Follow the US Reporting Season

Stay ahead of major beats, misses, and market surprises. Log in to your terminal, open a new account, or explore our dedicated earnings academy.

Need help? Contact our support team

GO Markets
March 31, 2026
US Earnings
Market insights
NVIDIA Corporation (NVDA): US earnings outlook

Expected earnings date: Wednesday, 25 February 2026 (US, after market close) / ~8:00 am, Thursday, 26 February 2026 (AEDT)

NVIDIA’s upcoming earnings release is expected to revolve around data centre revenue growth, the sustainability of AI-related demand, gross margin trajectory, and forward guidance into fiscal year 2027 (FY2027).  

Markets are likely to focus on capital expenditure trends, supply capacity, and management’s AI infrastructure outlook.

Some market participants may also view NVIDIA’s results as a useful signal for broader AI-related investment sentiment, although outcomes can still be influenced by company-specific factors and wider market conditions.  

Key areas in focus

Data centre (AI chips)

The data centre segment continues to be NVIDIA’s primary growth driver. Markets are likely to monitor revenue growth rates, gross margins, and guidance around AI accelerator demand.  

Gaming

NVIDIA also sells graphics cards for gaming PCs. Markets will watch whether this part of the business remains steady and profitable, particularly alongside broader consumer and PC-cycle trends.  

Automotive and Professional Visualisation

These are smaller divisions linked to AI development, design software and autonomous driving. They are not typically the main driver of near-term results, but commentary may be watched for signs of longer-term growth and product momentum.  

Profit margins and costs

Markets will assess how profitable NVIDIA remains, particularly as AI-related investment and supply scaling continue. Margins are one factor closely watched alongside revenue growth, guidance, and broader risk sentiment.  

What happened last quarter

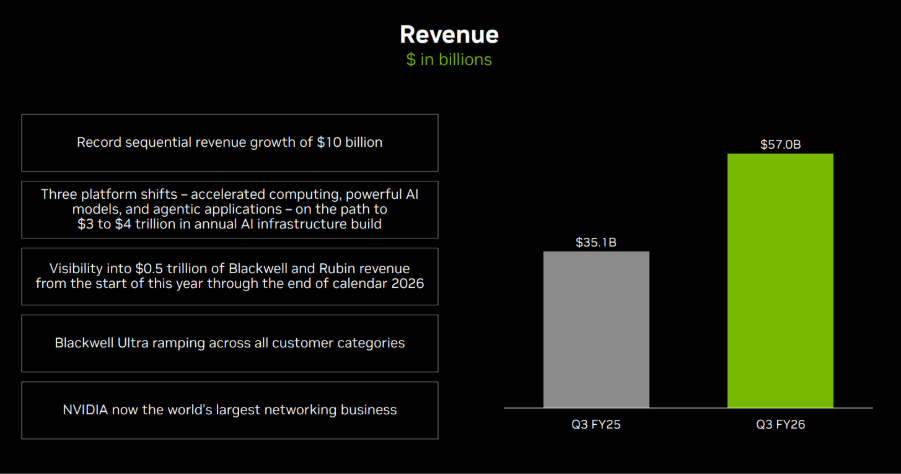
In its most recent quarterly update, NVIDIA reported strong year-on-year revenue growth, led primarily by data centre demand.

Management commentary and subsequent reporting referenced ongoing strength in AI accelerator demand and referenced continued supply-scaling initiatives.  

Last earnings key highlights

  • Revenue: US$57.0 billion
  • Earnings per share (EPS): US$1.30 (diluted)
  • Data centre revenue: US$51.2 billion
  • Gross margin: 73.4%
  • Operating income: US$36.0 billion
NVIDIA revenue Q3 FY25 - Q3 FY26 | NVIDIA investor presentation

What analysts expect this quarter

Bloomberg consensus estimates point to continued year-on-year revenue growth in the upcoming report, with markets focused on data centre performance and forward guidance into FY2027.  

Bloomberg consensus reference point:  

  • EPS: about US$1.52
  • Revenue: about US$65.5 billion
  • Full-year FY2027 EPS: about US$7.66

*All above points observed as of 16 February 2026.

Analysts broadly expect sustained AI-related demand, while attention remains on supply dynamics and the pace of any demand normalisation.  

Market-implied expectations

Listed options were pricing an indicative move of approximately ±7% to ±8% around the earnings release, based on near-dated, at-the-money (ATM) options-implied expected-move estimates. Implied volatility was approximately 48% annualised.

What this means for Australian investors

NVIDIA’s earnings may influence near-term sentiment and volatility across major US equity indices, including the NASDAQ 100, with potential spillover into the Asia session following the release.

It may also influence sentiment toward ASX-listed technology-exposed companies and ETFs with exposure to US large-cap growth sectors, although correlations can shift quickly around major events.

Australian-based investors may also wish to factor in AUD/USD currency moves, which can affect the local-currency translation of offshore equities and ETFs.

Important risk note

Immediately after the US close and into the early Asia session, Nasdaq 100 (NDX) futures and related CFD pricing can reflect thinner liquidity, wider spreads, and sharper repricing around new information.

Such an environment can increase gap risk and execution uncertainty relative to regular-hours conditions.

Mike Smith
February 17, 2026
US Earnings
Market insights
Alphabet Inc. (GOOGL): US earnings outlook

Expected earnings date: Wednesday, 4 February 2026 (US, after market close) / ~8:00 am, Thursday, 5 February 2026 (AEDT)

Alphabet’s earnings provide insight into global digital advertising demand, enterprise cloud spending, and broader technology-sector investment trends. 

As Google Search and YouTube are widely used by both consumers and businesses, results are often used as one input when assessing online activity and corporate marketing budgets, alongside other indicators. 

Key areas in focus

Search

Search advertising remains Alphabet’s largest revenue driver. Markets are likely to focus on ad growth rates, pricing metrics such as cost-per-click, and overall advertiser demand across sectors such as retail, travel, and small-to-medium businesses.

YouTube

YouTube contributes to both advertising and subscription revenue. Markets commonly monitor advertising momentum, engagement trends, and monetisation developments as indicators of digital media conditions and brand spending.  

Google Cloud

Sustained Cloud profitability is often discussed as a factor that may influence longer-term earnings expectations, though outcomes remain uncertain. Markets are expected to focus on revenue growth, enterprise adoption trends, and operating margins. 

Other bets

Initiatives such as autonomous driving and life sciences, while typically smaller contributors to revenue, markets may still watch spending levels and progress updates as indicators of capital allocation and cost discipline. 

Cost and margin framework

Management has previously flagged elevated capex tied to AI infrastructure, including data centres, specialised chips, and computing capacity. Traffic acquisition costs, staffing levels, and infrastructure expansion are also key variables influencing profitability. 

What happened last quarter

Alphabet’s most recent quarterly update highlighted advertising trends, Cloud profitability, and continued increases in capex to support AI initiatives. 

Management commentary has indicated that infrastructure spending is intended to support long-term competitiveness, while the market continues to assess the near-term margin trade-offs.  

Last earnings key highlights

For reported figures and segment detail from the most recent quarter, refer to Alphabet’s latest earnings release materials, including revenue, earnings per share (EPS), Services mix, Cloud operating income, and capex commentary. 

  • Revenue: US$102.35 billion
  • EPS: US$2.87
  • Operating income: US$31.23 billion
  • Services revenue: US$87.05 billion
  • Cloud revenue: US$15.16 billion

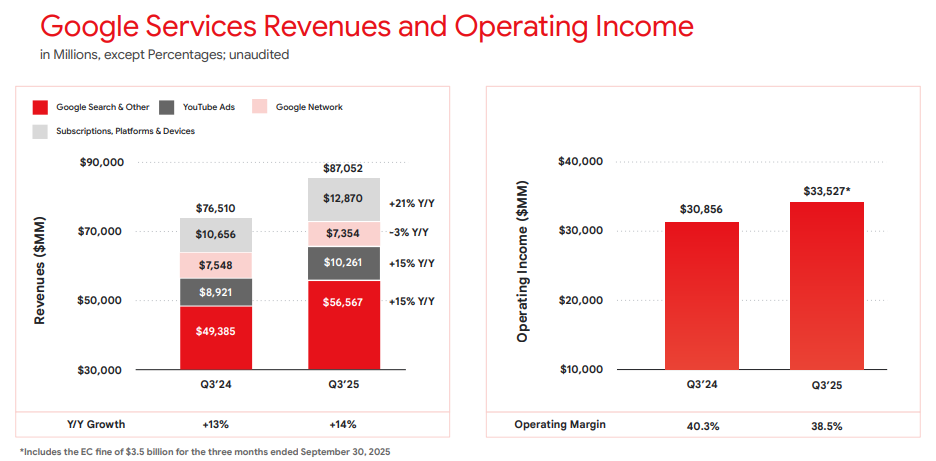
Google Services revenues and operating income Q3 2025 | Alphabet earnings release

What’s expected this quarter

Bloomberg consensus estimates moderate year-on-year (YoY) revenue growth and higher EPS versus the prior-year quarter, with ongoing focus on operating margins given AI-related investment. 

Bloomberg consensus reference points: 

  • EPS: low-to-mid US$2 range
  • Revenue: high US$80 billion to low US$90 billion range
  • Capex: expected to remain elevated

*All above points observed as of 31 January 2026.

Market-implied expectations

Listed options implied an indicative expected move of around ±4% to ±6% over the relevant near-dated expiry window. Movements derived from option prices observed at 11:00 am AEDT, 2 February 2026.

These are market-implied estimates and may change. Actual post-earnings price moves can be larger or smaller.

What this means for Australian market participants

Alphabet’s earnings can influence near-term sentiment across major US equity indices, particularly Nasdaq-linked products, with potential spillover into the Asia session following the release.

Important risk note

Immediately after the US close and into the early Asia session, Nasdaq 100 (NDX) futures and related CFD pricing can reflect thinner liquidity, wider spreads, and sharper repricing around new information. 

Such an environment can increase gap risk and execution uncertainty relative to regular-hours conditions.

Mike Smith
February 2, 2026
US Earnings
Market insights
Amazon (AMZN): US earnings outlook

Expected earnings date: Thursday, 5 February 2026 (US, after market close)/early Friday, 6 February 2026

Amazon’s earnings provide insight into global consumer spending trends, cloud infrastructure demand, and the monetisation of its ecosystem across retail, advertising, and subscription services.

Focus is expected to remain on performance across key business areas, along with commentary on cost efficiency, capital expenditure, and AI-related investments, including data centre expansion. 

Key areas in focus

Online stores and third-party services

Amazon’s core retail business remains sensitive to discretionary consumer demand, particularly through the December-quarter holiday period. Markets are likely to focus on revenue growth and margins across both first-party retail and third-party seller services. Cost pressures will also be evaluated. 

AWS (Amazon Web Services)

AWS is a key earnings driver. Investors are likely to focus on revenue growth rates, margin trends, and indications around enterprise cloud spending. AI workloads will also be noteworthy. Any commentary on capacity expansion and capex is likely to be closely watched.  

Advertising services

Amazon’s advertising business has become an increasingly important profit contributor. Markets are likely to assess growth momentum, advertiser demand, and how advertising integrates across Amazon’s retail and Prime ecosystems.  

Subscription services (including Prime)

Subscription revenue includes Prime memberships and related digital services. Investors may watch engagement, pricing dynamics, and retention trends as indicators of ecosystem strength. 

Cost and margin framework

Management has previously emphasised the need for cost discipline across fulfilment, logistics, and corporate expenses. Reported operating margins and any updates on efficiency gains or reinvestment priorities across key business services will be of interest. 

What happened last quarter

Amazon’s most recent quarterly update reported revenue growth and operating income outcomes, with AWS and advertising referenced as key contributors, alongside ongoing cost-control measures across the retail business. 

The prior update also included discussion relevant to investment priorities in cloud and AI infrastructure, which continue to influence market expectations. 

Last earnings key highlights

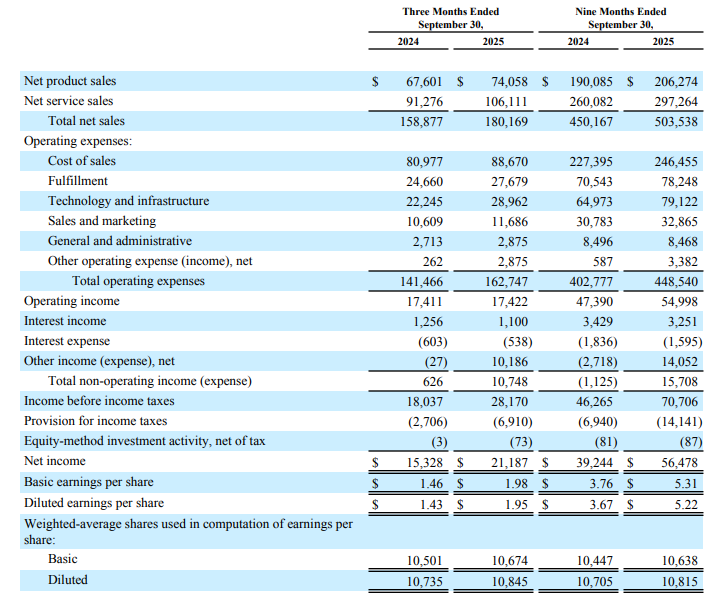
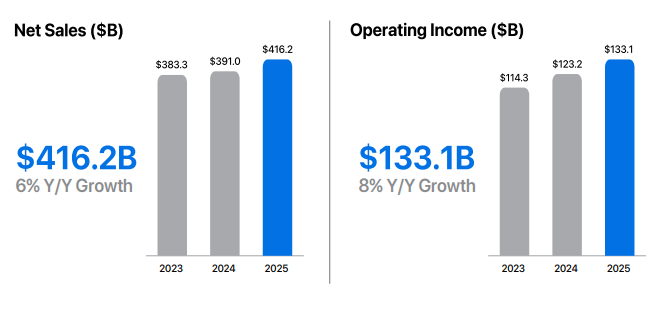
  • Revenue: US$180.2 billion 
  • Earnings per share (EPS): US$1.95 (diluted) 
  • AWS revenue: US$33.0 billion 
  • Advertising services revenue: US$17.7 billion 
  • Operating income: US$17.4 billion 

How the market reacted last time

Amazon shares moved higher in after-hours trading following the previous release, based on reporting at the time. 

Amazon Q3 2025 Consolidated Statements of Operations

What’s expected this quarter

Bloomberg consensus estimates point to year-on-year EPS growth for the quarter ended December 2025, with markets focused on the revenue outcome, operating margins, and AWS performance, given the importance of the December quarter (Q4) to Amazon’s earnings profile. 

Bloomberg consensus reference points (January 2026):

  • EPS: about US$1.60 
  • Revenue: about US$170 billion 
  • Full-year FY2026 EPS: about US$5.10 

*All above points observed as of 27 January 2026.

Expectations

Market sentiment around Amazon may be sensitive to any disappointment in AWS growth, operating margins, or December-quarter (Q4 2025) retail performance, given the stock’s large index weighting within major US equity indices and its role in these areas. 

Listed options were pricing an indicative move of around ±4% to ±5% based on near-dated, at-the-money options-implied expected move estimates observed on Barchart at 11:00 am AEDT, 28 January 2026. 

Implied volatility was approximately 32% annualised at that time. 

These are market-implied estimates (not a forecast) and may change. Actual post-earnings price moves can be larger or smaller.

What this means for Australian investors

Amazon’s earnings can influence near-term sentiment across major US equity indices, with potential spillover into the Asia session following the release. It may also influence sentiment towards ASX-listed companies with significant online sales exposure.

Important risk note 

Immediately after the US close and into the early Asia session, Nasdaq 100 (NDX) futures and related CFD pricing can reflect thinner liquidity, wider spreads, and sharper repricing around new information. 

Such an environment can increase gap risk and execution uncertainty relative to regular-hours conditions.

Mike Smith
January 30, 2026
US Earnings
Market insights
Apple Inc. (AAPL): US earnings outlook

Expected earnings date: Thursday, 29 January 2026 (US, after market close) / early Friday, 30 January 2026 (AEDT)

Key areas in focus

iPhone

The iPhone remains Apple’s largest revenue driver. Markets are likely to focus on unit demand, product mix (including higher-end models), and any signals on upgrade momentum and regional trends.

Services

Investors are likely to focus on growth across areas such as the App Store, iCloud, Apple Music and other subscriptions, alongside any commentary on average revenue per user (ARPU). The size and engagement of Apple’s installed base remain central to overall performance.

Wearables, home and accessories

This segment includes products such as Apple Watch, AirPods, Beats headphones, home-related devices, and accessories. Investors are likely to watch revenue trends in this segment as an indicator of discretionary consumer demand. 

Cost and margin framework

Management has flagged tariff and component cost pressures in prior commentary. Markets may remain sensitive to gross margin commentary and any signals of incremental cost pressure or mitigation strategies. 

What happened last quarter

Apple’s most recent quarterly update (fiscal Q4 2025) highlighted record September-quarter revenue and EPS, alongside record Services revenue and continued emphasis on installed-base strength.  

The prior update also included discussion of holiday-quarter expectations and cost headwinds (including tariffs), which have influenced expected margins and management guidance.

Last earnings key highlights

  • Revenue: US$102.5 billion 
  • Earnings per share (EPS): US$1.85 (diluted) 
  • iPhone revenue: US$49.03 billion 
  • Services revenue: US$28.75 billion 
  • Net income: US$27.5 billion 

How the market reacted last time

Apple shares rose in after-hours trading following the release, as investors assessed the results against analyst expectations and management’s holiday-quarter commentary, including tariff-related cost pressures and regional demand considerations. 

Apple 2025 business highlights

What’s expected this quarter

Bloomberg consensus points to year-on-year EPS growth, with markets also focused on the revenue outcome and gross margins, given the scale and importance of the holiday quarter for Apple’s earnings profile. 

Bloomberg consensus reference points (January 2026):

  • EPS: about US$2.65 
  • Revenue: about US$138 billion 
  • Full-year FY2026 EPS: about US$8.1 

*All above points observed as of 26 January 2026.

Expectations

Sentiment around Apple may be sensitive to any disappointment on holiday-quarter revenue, Services momentum, or margin commentary, given the stock’s large index weight and the importance of this reporting period. 

Listed options were implying an indicative move of around ±3% to ±4% based on near-dated, at-the-money options-implied expected move estimates observed on Barchart at 11:00 am AEDT on 25 January 2026.  Implied volatility was approximately 29% annualised at that time. 

These are market-implied estimates (not a forecast) and may change. Actual post-earnings price moves can be larger or smaller.

What this means for Australian traders

Apple’s earnings can influence near-term sentiment across major US equity indices, particularly Nasdaq-linked products, with potential spillover into the Asia session following the release.

Important risk note 

Immediately after the US close and into the early Asia session, Nasdaq 100 (NDX) futures and related CFD pricing can reflect thinner liquidity, wider spreads, and sharper repricing around new information. 

Such an environment can increase gap risk and execution uncertainty relative to regular-hours conditions.

Mike Smith
January 28, 2026