
交易美国财报季
2026年第一季度财报季可能迅速推动市场波动。跟踪即将发布的财报,规划您的关注列表,并使用专为活跃交易者打造的工具交易美国股票差价合约。

Most watched this season
Apple • Microsoft • Alphabet • Amazon • Nvidia • Meta • Tesla
与 GO Markets 一起交易美国财报季
美国财报季将带来美国主要上市公司的集中业绩更新。财报结果、业绩指引与市场预期可能迅速变化,引发个股、行业及更广泛指数的波动。
具竞争力的价格
在快速变动的财报发布期交易时,关注交易成本。
技术分析工具
使用图表和指标来规划入场、出场与风险。
为活跃交易而打造
享受快速执行与稳定可靠的平台。
风险管理工具
使用内置工具界定下行风险,并在波动中保护仓位。
更多交易时间
部分美国股票差价合约支持延长交易时段,让您在标准交易时段之外也有更多时间进行交易。*
*可用性因产品而异。常规交易时段以外的交易条件可能不同。

本季最受关注
美国财报日历
显示的时间采用澳大利亚东部标准时间(GMT+10)。您可随时在财报日历设置中更改时区。
新闻与分析


现状是:四月美股财报季拉开帷幕,但市场情绪远非寻常。正如 GO Markets 在《全球美股财报策略:交易者核心指南》中所述,随着市场关注点的深度迁移,本次财报期意义非凡。这不再仅仅关乎不惜代价地追逐增长,更在于探寻财务数字背后的深层逻辑。
置身 2026 年,这些财务信号正与“高摩擦”的宏观背景迎头相撞:
- 地缘政治冲突: 中东局势持续紧张
- 原油供应冲击: 布伦特原油突破 100 美元大关
- 美联储动态: 中央银行仍受困于“粘性通胀”
转向“韧性增长”诚然,人工智能(AI)仍是市场的主旋律,也是吸引多数目光的“超级引擎”。但在喧嚣之下,资金正悄然流向那些更具“抗压性”的企业——即那些在逆境中依然表现稳健的行业领头羊。
当利率前景不明、能源市场承压时,摩根大通(JPMorgan Chase)以及主要的国防承包商等权重股的重要性愈发凸显。这些标的并非要取代人工智能的叙事地位,而是成为了交易者衡量风险偏好与盈利韧性的新维度。归根结底,市场正在寻找更稳健的资产锚点。

如果你在过去一年里密切关注市场,你会发现“不计成本追求增长”的时代已经宣告终结。2026年4月的财报周期正值市场重心发生结构性重构的关键时刻。现在,这已不再仅仅关乎损益表上的数字,更关乎隐藏在数字背后的深层信号。
随着利率不确定性的持续以及地缘政治冲击将油价推高至100美元以上,交易逻辑已从单纯的AI炒作转向对机构韧性和算力工业化的审视。对于澳大利亚、亚洲和拉丁美洲的交易者而言,这些财报结果将成为全球风险偏好及新兴“安全超级周期”的情绪风向标。
为何盘前 (BMO) 与盘后 (AMC) 发布时点至关重要
业绩在美股正规交易时段开启前发布,因此价格发现过程主要发生在流动性通常较为匮乏的盘前交易中,这往往会导致市场走势被放大。而 <strong>盘后 (AMC)</strong> 业绩在收盘后发布,这意味着市场反应会被压缩至次日早晨极短的盘前窗口内。了解公司选择在哪个时间段发布财报,其重要性不亚于分析财报的具体内容。
值得一问的是:这种显而易见的交易已经为完美定价了吗?
2026 年正展现出其作为“证伪之年”的特质。在过去两年中投入巨额资金布局人工智能的企业,现在必须向市场交出投资回报率(ROI)的实证答卷。市场已不再满足于单纯的人工智能投资规划,转而开始奖赏那些能展现由 AI 驱动实质性营收增长的确定性证据。
针对每一份财报,交易者应当采取更深层的评估维度:你是在对头条数据进行应激式反应,还是在评估该公司在物理 AI 供应链中的核心作用,抑或其作为潜在波动对冲工具的防御价值?这些是性质截然不同的分析逻辑,往往会导向完全相反的仓位部署决策。

Expected earnings date: Wednesday, 25 February 2026 (US, after market close) / ~8:00 am, Thursday, 26 February 2026 (AEDT)
NVIDIA’s upcoming earnings release is expected to revolve around data centre revenue growth, the sustainability of AI-related demand, gross margin trajectory, and forward guidance into fiscal year 2027 (FY2027).
Markets are likely to focus on capital expenditure trends, supply capacity, and management’s AI infrastructure outlook.
Some market participants may also view NVIDIA’s results as a useful signal for broader AI-related investment sentiment, although outcomes can still be influenced by company-specific factors and wider market conditions.
Key areas in focus
Data centre (AI chips)
The data centre segment continues to be NVIDIA’s primary growth driver. Markets are likely to monitor revenue growth rates, gross margins, and guidance around AI accelerator demand.
Gaming
NVIDIA also sells graphics cards for gaming PCs. Markets will watch whether this part of the business remains steady and profitable, particularly alongside broader consumer and PC-cycle trends.
Automotive and Professional Visualisation
These are smaller divisions linked to AI development, design software and autonomous driving. They are not typically the main driver of near-term results, but commentary may be watched for signs of longer-term growth and product momentum.
Profit margins and costs
Markets will assess how profitable NVIDIA remains, particularly as AI-related investment and supply scaling continue. Margins are one factor closely watched alongside revenue growth, guidance, and broader risk sentiment.
What happened last quarter
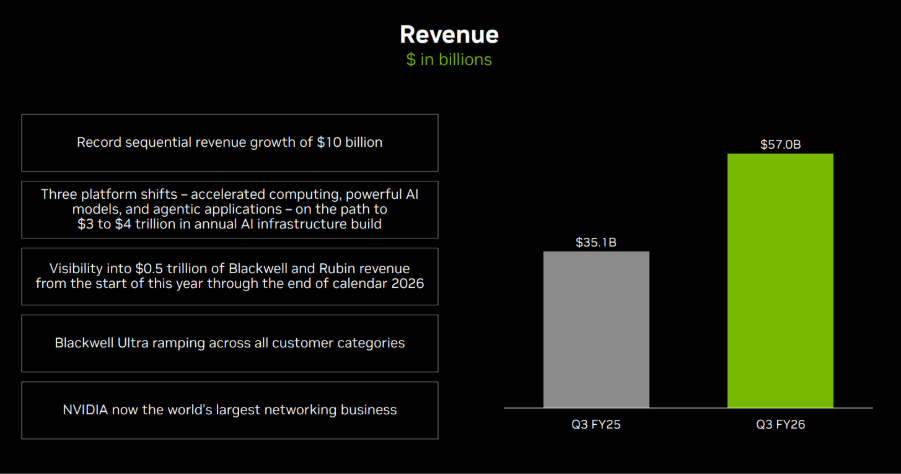
In its most recent quarterly update, NVIDIA reported strong year-on-year revenue growth, led primarily by data centre demand.
Management commentary and subsequent reporting referenced ongoing strength in AI accelerator demand and referenced continued supply-scaling initiatives.
Last earnings key highlights
- Revenue: US$57.0 billion
- Earnings per share (EPS): US$1.30 (diluted)
- Data centre revenue: US$51.2 billion
- Gross margin: 73.4%
- Operating income: US$36.0 billion
What analysts expect this quarter
Bloomberg consensus estimates point to continued year-on-year revenue growth in the upcoming report, with markets focused on data centre performance and forward guidance into FY2027.
Bloomberg consensus reference point:
- EPS: about US$1.52
- Revenue: about US$65.5 billion
- Full-year FY2027 EPS: about US$7.66
*All above points observed as of 16 February 2026.
Analysts broadly expect sustained AI-related demand, while attention remains on supply dynamics and the pace of any demand normalisation.
Market-implied expectations
Listed options were pricing an indicative move of approximately ±7% to ±8% around the earnings release, based on near-dated, at-the-money (ATM) options-implied expected-move estimates. Implied volatility was approximately 48% annualised.
What this means for Australian investors
NVIDIA’s earnings may influence near-term sentiment and volatility across major US equity indices, including the NASDAQ 100, with potential spillover into the Asia session following the release.
It may also influence sentiment toward ASX-listed technology-exposed companies and ETFs with exposure to US large-cap growth sectors, although correlations can shift quickly around major events.
Australian-based investors may also wish to factor in AUD/USD currency moves, which can affect the local-currency translation of offshore equities and ETFs.
Important risk note
Immediately after the US close and into the early Asia session, Nasdaq 100 (NDX) futures and related CFD pricing can reflect thinner liquidity, wider spreads, and sharper repricing around new information.
Such an environment can increase gap risk and execution uncertainty relative to regular-hours conditions.

Expected earnings date: Wednesday, 4 February 2026 (US, after market close) / ~8:00 am, Thursday, 5 February 2026 (AEDT)
Alphabet’s earnings provide insight into global digital advertising demand, enterprise cloud spending, and broader technology-sector investment trends.
As Google Search and YouTube are widely used by both consumers and businesses, results are often used as one input when assessing online activity and corporate marketing budgets, alongside other indicators.
Key areas in focus
Search
Search advertising remains Alphabet’s largest revenue driver. Markets are likely to focus on ad growth rates, pricing metrics such as cost-per-click, and overall advertiser demand across sectors such as retail, travel, and small-to-medium businesses.
YouTube
YouTube contributes to both advertising and subscription revenue. Markets commonly monitor advertising momentum, engagement trends, and monetisation developments as indicators of digital media conditions and brand spending.
Google Cloud
Sustained Cloud profitability is often discussed as a factor that may influence longer-term earnings expectations, though outcomes remain uncertain. Markets are expected to focus on revenue growth, enterprise adoption trends, and operating margins.
Other bets
Initiatives such as autonomous driving and life sciences, while typically smaller contributors to revenue, markets may still watch spending levels and progress updates as indicators of capital allocation and cost discipline.
Cost and margin framework
Management has previously flagged elevated capex tied to AI infrastructure, including data centres, specialised chips, and computing capacity. Traffic acquisition costs, staffing levels, and infrastructure expansion are also key variables influencing profitability.
What happened last quarter
Alphabet’s most recent quarterly update highlighted advertising trends, Cloud profitability, and continued increases in capex to support AI initiatives.
Management commentary has indicated that infrastructure spending is intended to support long-term competitiveness, while the market continues to assess the near-term margin trade-offs.
Last earnings key highlights
For reported figures and segment detail from the most recent quarter, refer to Alphabet’s latest earnings release materials, including revenue, earnings per share (EPS), Services mix, Cloud operating income, and capex commentary.
- Revenue: US$102.35 billion
- EPS: US$2.87
- Operating income: US$31.23 billion
- Services revenue: US$87.05 billion
- Cloud revenue: US$15.16 billion
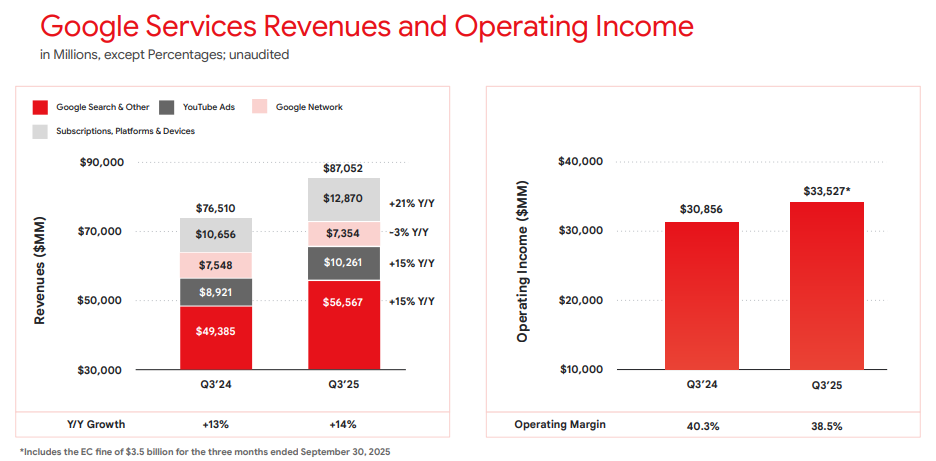
Google Services revenues and operating income Q3 2025 | Alphabet earnings release
What’s expected this quarter
Bloomberg consensus estimates moderate year-on-year (YoY) revenue growth and higher EPS versus the prior-year quarter, with ongoing focus on operating margins given AI-related investment.
Bloomberg consensus reference points:
- EPS: low-to-mid US$2 range
- Revenue: high US$80 billion to low US$90 billion range
- Capex: expected to remain elevated
*All above points observed as of 31 January 2026.
Market-implied expectations
Listed options implied an indicative expected move of around ±4% to ±6% over the relevant near-dated expiry window. Movements derived from option prices observed at 11:00 am AEDT, 2 February 2026.
These are market-implied estimates and may change. Actual post-earnings price moves can be larger or smaller.
What this means for Australian market participants
Alphabet’s earnings can influence near-term sentiment across major US equity indices, particularly Nasdaq-linked products, with potential spillover into the Asia session following the release.
Important risk note
Immediately after the US close and into the early Asia session, Nasdaq 100 (NDX) futures and related CFD pricing can reflect thinner liquidity, wider spreads, and sharper repricing around new information.
Such an environment can increase gap risk and execution uncertainty relative to regular-hours conditions.

Expected earnings date: Thursday, 5 February 2026 (US, after market close)/early Friday, 6 February 2026
Amazon’s earnings provide insight into global consumer spending trends, cloud infrastructure demand, and the monetisation of its ecosystem across retail, advertising, and subscription services.
Focus is expected to remain on performance across key business areas, along with commentary on cost efficiency, capital expenditure, and AI-related investments, including data centre expansion.
Key areas in focus
Online stores and third-party services
Amazon’s core retail business remains sensitive to discretionary consumer demand, particularly through the December-quarter holiday period. Markets are likely to focus on revenue growth and margins across both first-party retail and third-party seller services. Cost pressures will also be evaluated.
AWS (Amazon Web Services)
AWS is a key earnings driver. Investors are likely to focus on revenue growth rates, margin trends, and indications around enterprise cloud spending. AI workloads will also be noteworthy. Any commentary on capacity expansion and capex is likely to be closely watched.
Advertising services
Amazon’s advertising business has become an increasingly important profit contributor. Markets are likely to assess growth momentum, advertiser demand, and how advertising integrates across Amazon’s retail and Prime ecosystems.
Subscription services (including Prime)
Subscription revenue includes Prime memberships and related digital services. Investors may watch engagement, pricing dynamics, and retention trends as indicators of ecosystem strength.
Cost and margin framework
Management has previously emphasised the need for cost discipline across fulfilment, logistics, and corporate expenses. Reported operating margins and any updates on efficiency gains or reinvestment priorities across key business services will be of interest.
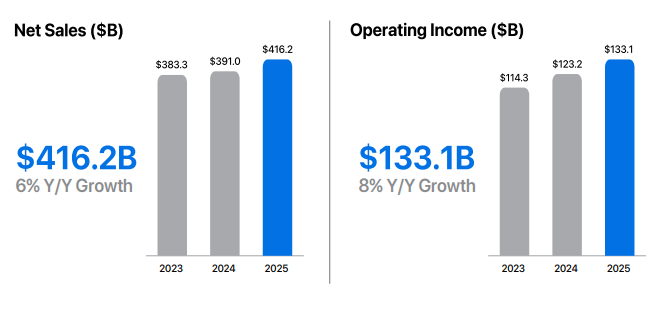
What happened last quarter
Amazon’s most recent quarterly update reported revenue growth and operating income outcomes, with AWS and advertising referenced as key contributors, alongside ongoing cost-control measures across the retail business.
The prior update also included discussion relevant to investment priorities in cloud and AI infrastructure, which continue to influence market expectations.
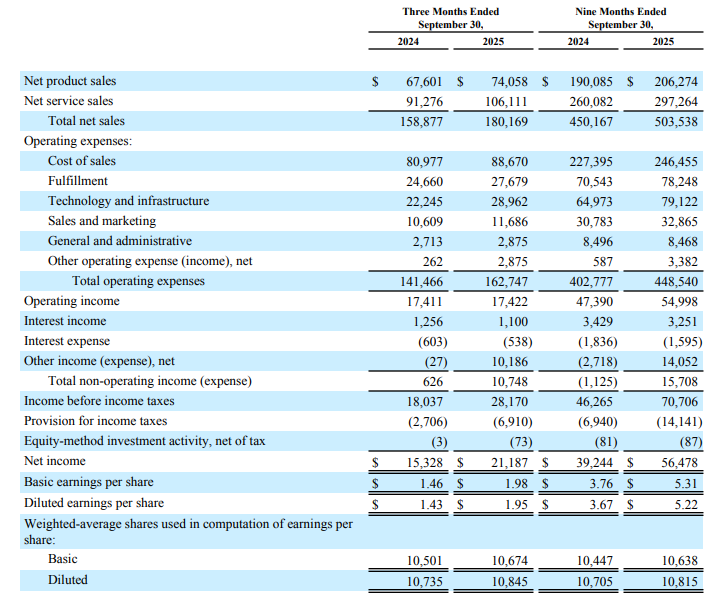
Last earnings key highlights
- Revenue: US$180.2 billion
- Earnings per share (EPS): US$1.95 (diluted)
- AWS revenue: US$33.0 billion
- Advertising services revenue: US$17.7 billion
- Operating income: US$17.4 billion
How the market reacted last time
Amazon shares moved higher in after-hours trading following the previous release, based on reporting at the time.
What’s expected this quarter
Bloomberg consensus estimates point to year-on-year EPS growth for the quarter ended December 2025, with markets focused on the revenue outcome, operating margins, and AWS performance, given the importance of the December quarter (Q4) to Amazon’s earnings profile.
Bloomberg consensus reference points (January 2026):
- EPS: about US$1.60
- Revenue: about US$170 billion
- Full-year FY2026 EPS: about US$5.10
*All above points observed as of 27 January 2026.
Expectations
Market sentiment around Amazon may be sensitive to any disappointment in AWS growth, operating margins, or December-quarter (Q4 2025) retail performance, given the stock’s large index weighting within major US equity indices and its role in these areas.
Listed options were pricing an indicative move of around ±4% to ±5% based on near-dated, at-the-money options-implied expected move estimates observed on Barchart at 11:00 am AEDT, 28 January 2026.
Implied volatility was approximately 32% annualised at that time.
These are market-implied estimates (not a forecast) and may change. Actual post-earnings price moves can be larger or smaller.
What this means for Australian investors
Amazon’s earnings can influence near-term sentiment across major US equity indices, with potential spillover into the Asia session following the release. It may also influence sentiment towards ASX-listed companies with significant online sales exposure.
Important risk note
Immediately after the US close and into the early Asia session, Nasdaq 100 (NDX) futures and related CFD pricing can reflect thinner liquidity, wider spreads, and sharper repricing around new information.
Such an environment can increase gap risk and execution uncertainty relative to regular-hours conditions.

Expected earnings date: Thursday, 29 January 2026 (US, after market close) / early Friday, 30 January 2026 (AEDT)
Key areas in focus
iPhone
The iPhone remains Apple’s largest revenue driver. Markets are likely to focus on unit demand, product mix (including higher-end models), and any signals on upgrade momentum and regional trends.
Services
Investors are likely to focus on growth across areas such as the App Store, iCloud, Apple Music and other subscriptions, alongside any commentary on average revenue per user (ARPU). The size and engagement of Apple’s installed base remain central to overall performance.
Wearables, home and accessories
This segment includes products such as Apple Watch, AirPods, Beats headphones, home-related devices, and accessories. Investors are likely to watch revenue trends in this segment as an indicator of discretionary consumer demand.
Cost and margin framework
Management has flagged tariff and component cost pressures in prior commentary. Markets may remain sensitive to gross margin commentary and any signals of incremental cost pressure or mitigation strategies.
What happened last quarter
Apple’s most recent quarterly update (fiscal Q4 2025) highlighted record September-quarter revenue and EPS, alongside record Services revenue and continued emphasis on installed-base strength.
The prior update also included discussion of holiday-quarter expectations and cost headwinds (including tariffs), which have influenced expected margins and management guidance.
Last earnings key highlights
- Revenue: US$102.5 billion
- Earnings per share (EPS): US$1.85 (diluted)
- iPhone revenue: US$49.03 billion
- Services revenue: US$28.75 billion
- Net income: US$27.5 billion
How the market reacted last time
Apple shares rose in after-hours trading following the release, as investors assessed the results against analyst expectations and management’s holiday-quarter commentary, including tariff-related cost pressures and regional demand considerations.
What’s expected this quarter
Bloomberg consensus points to year-on-year EPS growth, with markets also focused on the revenue outcome and gross margins, given the scale and importance of the holiday quarter for Apple’s earnings profile.
Bloomberg consensus reference points (January 2026):
- EPS: about US$2.65
- Revenue: about US$138 billion
- Full-year FY2026 EPS: about US$8.1
*All above points observed as of 26 January 2026.
Expectations
Sentiment around Apple may be sensitive to any disappointment on holiday-quarter revenue, Services momentum, or margin commentary, given the stock’s large index weight and the importance of this reporting period.
Listed options were implying an indicative move of around ±3% to ±4% based on near-dated, at-the-money options-implied expected move estimates observed on Barchart at 11:00 am AEDT on 25 January 2026. Implied volatility was approximately 29% annualised at that time.
These are market-implied estimates (not a forecast) and may change. Actual post-earnings price moves can be larger or smaller.
What this means for Australian traders
Apple’s earnings can influence near-term sentiment across major US equity indices, particularly Nasdaq-linked products, with potential spillover into the Asia session following the release.
Important risk note
Immediately after the US close and into the early Asia session, Nasdaq 100 (NDX) futures and related CFD pricing can reflect thinner liquidity, wider spreads, and sharper repricing around new information.
Such an environment can increase gap risk and execution uncertainty relative to regular-hours conditions.