
市场资讯及洞察
.jpeg)
4 月的美股财报季正拉开序幕,而当下的市场追求的不仅仅是一个动听的故事。
正如 GO Markets 在最近的《国防股财报观察名单》中所强调的,本轮财报季标志着市场核心关注点发生了更广泛的转变。现在,投资者不再仅仅追求“不计代价的增长”,交易员们更渴望洞察潜藏在数据背后的真实信息。
为什么这三家公司至关重要?
在当前的市场环境下,特斯拉 (Tesla)、NextEra Energy 和埃克森美孚 (Exxon Mobil) 成为了焦点。它们分别代表了 2026 年的三大核心叙事:自动驾驶、电力需求以及原油供应风险。
- 特斯拉 (Tesla): 市场正在评估其自动驾驶和能源业务是否足以支撑下一阶段的增长。
- NextEra Energy: 为观察电力需求激增以及满足该需求所需的基础设施建设提供了一个窗口。
- 埃克森美孚 (Exxon Mobil): 在供应风险持续存在的背景下,处于原油与能源安全叙事的中心。
综合来看,这三家公司有助于解释市场关注点的转移趋势:现在的关键不再是谁的叙事最动人,而是谁能展现出真实的需求、更稳健的利润率,以及在日益复杂的宏观背景下依然坚韧的执行力。
在 2026 年,AI 驱动的电力需求正将公用事业、储能和电网容量推向聚光灯下;与此同时,原油供应风险也让**“能源安全”**重新回到了市场的核心对话之中。


US and European market attention this week is centred on the US Personal Income and Outlays report (which includes the PCE price index), late-week flash PMI releases, and a continued ramp-up in the US earnings season.
Alongside key data, geopolitical developments, including renewed discussion around Greenland and tariff threats, remain part of the broader risk backdrop.
Quick facts:
- US PCE inflation: Closely watched by policymakers as an important inflation measure (released within the Personal Income and Outlays report).
- Flash PMIs: US, Eurozone, Germany, and the UK are due late week, offering a read on growth momentum.
- US earnings: Large-cap and index-heavy companies shaping sentiment at elevated index levels.
- Geopolitical headlines: Greenland and proposed tariff measures add a layer of uncertainty to broader risk sentiment.
- Equity indices: Trading at elevated levels, which may increase sensitivity to data and earnings surprises.
United States
What to watch
US markets reopen after the Juneteenth holiday, with the US data calendar featuring the PCE price index and core PCE measures. Outcomes that differ from expectations can influence interest-rate expectations and near-term risk sentiment.
Later in the week, flash PMIs offer a more current snapshot of activity across manufacturing and services. US earnings remain a key driver of sentiment, and with indices at elevated levels, valuation and guidance narratives may be tested as results are released.
Key releases and events
- Thu 22 Jan (US): BEA GDP release — Q3 2025 (Updated Estimate)
- Thu 22 Jan (US): BEA Personal Income and Outlays (Oct & Nov 2025) — includes PCE price index and core PCE
- Fri 23 Jan (US): S&P Global flash PMIs (manufacturing and services)
- Throughout the week: US earnings season continues
How markets may respond
- Equities: Indices have been trading at elevated levels. As of 10:30am AEDT, 20 January 2026, the S&P 500 was within ~50 points of its record high.
- USD: PCE results that differ from expectations can contribute to volatility in FX and USD-linked assets, while PMI data can influence shorter-term momentum.
- Earnings: In a market trading at elevated levels, earnings results and forward guidance can generate volatility even without large headline misses. Forward guidance and margin commentary are likely to be closely watched.
UK and eurozone
What to watch
In the UK, CPI and labour market data can influence rate expectations and perceptions of growth momentum. In Germany, producer price data offers insight into pipeline inflation pressures. Flash PMIs across the Eurozone, Germany, and the UK complete the week’s calendar and may influence near-term growth assessments.
Key releases and events
Eurozone and Germany
- Thu 22 Jan: Germany PPI
- Fri 23 Jan: Eurozone flash manufacturing PMI (with services PMI)
- Fri 23 Jan: Germany flash manufacturing PMI
United Kingdom
- Wed 21 Jan: UK CPI
- Thu 22 Jan: UK labour market report
- Fri 23 Jan: UK flash manufacturing PMI (with services PMI)
How markets may respond
- DAX: The German index has been trading at elevated levels. PMI and PPI outcomes may influence cyclical sectors, notably industrials and exporters.
- FTSE 100 and GBP: UK CPI and labour market data can affect rate expectations and GBP sensitivity, while PMI outcomes may influence sector-level performance within the index.
- EUR: Euro moves may reflect PMI momentum and inflation signals, though direction can still be heavily influenced by US outcomes and global risk sentiment.
Geopolitics
Reporting has focused on renewed discussion around Greenland and associated tariff threats. Reporting also outlines tariff rates and potential escalation timelines, though details and implementation remain subject to change, and the situation is fluid.
Market reaction has been limited so far. If rhetoric escalates, markets could see intermittent volatility across equities, commodities, and FX. safe-haven moves (including in gold) are possible, though reactions can be uneven and may reverse.
US and Europe calendar summary
- Wed 21 Jan: UK CPI
- Thu 22 Jan (US) / Fri 23 Jan(AEDT):
- US GDP (Q3 2025 updated estimate)
- US Personal Income and Outlays (Oct/Nov, includes PCE)
- UK labour market report
- Fri 23 Jan: Flash PMIs (US, Eurozone, Germany, UK)
Bottom line
- The Personal Income and Outlays report (including PCE inflation measures) is one of the key US macro events this week and may influence rate expectations if outcomes differ materially from expectations.
- With equity indices trading at elevated levels, markets may be more sensitive to negative surprises and guidance downgrades than to confirmatory data.
- European releases — particularly UK CPI and the flash PMIs — remain important locally but may still trade in the context of US outcomes and broader risk sentiment.
- Geopolitical developments around Greenland and tariffs remain a secondary but persistent source of uncertainty.

Asia-Pacific markets head into this week focused on China’s growth data, potential JPY volatility with a Bank of Japan (BoJ) meeting week, and Australia's labour force report and commodity prices. Geopolitical events also remain in focus globally, and the US earnings season’s progression may indirectly influence sentiment.
Quick facts:
- China: Q4 GDP and December industrial production data will be read as a test of whether growth is stabilising or simply slowing more gradually.
- Japan: The BoJ meets 22–23 January, and Japan CPI (Dec) is due on 23 January, keeping USD/JPY and rates in focus.
- Australia: Labour Force (Dec) is the key local catalyst, alongside whether metal prices continue to support the materials sector.
China
What to watch:
China’s focus shifts to hard activity data, with Q4 GDP and December activity indicators offering a read on growth momentum into 2026. Markets are increasingly focused on whether recent policy support is translating into clearer traction in the real economy.
Key releases:
- Mon 19 Jan: Q4 GDP, December industrial production (primary). Retail sales and fixed asset investment (secondary).
How markets may respond:
- Growth-sensitive sectors in Chinese equities may react if the data reinforces that domestic demand remains soft, especially if headline GDP diverges from expectations.
- Australian assets may respond to GDP and industrial output outcomes, with implications for materials stocks. The data may also influence AUD sentiment following recent consolidation.
Japan
With the BoJ meeting later in the week, markets may see pre-decision volatility as positioning shifts around how hawkish the BoJ narrative may be. While consensus expectations often lean toward no change, the statement and press conference will be watched closely for any change in tone.
Key events:
- Fri 23 Jan: Bank of Japan rate decision and press conference (high sensitivity)
- Fri 23 Jan: Japan CPI (Dec) (medium sensitivity)
- Thu 22 Jan: Trade statistics — first 20 days of Dec (provisional) (low sensitivity)
How markets may respond:
- USD/JPY: Often acts as a fast channel for repricing Japan risk during BoJ weeks, particularly if guidance shifts expectations for the next move.
- Nikkei 225: Japanese equities can remain responsive to FX stability, particularly across exporter-heavy sectors. All-time high levels of 54000 will be watched as a key level.
Australia
Australia’s week is dominated by the employment data, with external influences from China’s data and broader global risk conditions also in view. Markets will likely focus on the balance between employment growth and participation and what it implies for Reserve Bank of Australia (RBA) expectations.
Key release:
- Thu 22 Jan: Labour force, Australia (Dec) (high sensitivity)
How markets may respond:
- ASX 200: Domestic cyclicals can react to the rates takeaway more than the headline jobs number. After the material-driven move back over 8800, this week will be key in determining whether a test of the psychologically important 9000 is on the cards.
- AUD/USD: Rate expectations can shift quickly. A stronger-than-expected jobs result could support the AUD, while a weaker print (or a rise in unemployment) could weigh on it.
Asia-Pacific calendar summary (AEDT)
- Mon 19 Jan: China GDP (Q4), industrial production and retail sales
- Tue 20 Jan: China Loan Prime Rate (1Y/5Y) (Jan)
- Thu 22 Jan: Australia employment (Dec); Japan trade statistics — first 20 days of Dec (provisional)
- Fri 23 Jan: BoJ rate decision and press conference; Japan CPI (Dec). PMI manufacturing in Australia and Japan.
Bottom line
Asia-Pacific markets enter the week with China’s growth data setting the regional tone, Japan facing heightened FX sensitivity into a BoJ meeting, and Australia focused on labour-market signals alongside commodity price direction.
Chinese GDP and industrial production are a test of whether activity is stabilising, with implications for regional risk appetite, materials pricing and the AUD.
In Japan, any shift in BoJ communication could drive USD/JPY volatility and spill into broader equity sentiment. For Australia, local employment data and external influences, particularly China and global risk conditions, are likely to shape short-term expectations across rates, equities and currency markets.
.jpg)
AI的热度持续已久, 我们看着英伟达股价上蹿下跳来到高位,很多朋友问我:“现在追高不敢,不买又怕踏空,到底该怎么办?”其实,在半导体这个巨大的星系里,如果说英伟达是最亮的恒星,那么 台积电(TSM) 就是维持整个星系运转的万有引力。就刚刚,台积电交出了一份堪称“炸裂”的成绩单。今天我们就来扒一扒,这位AI时代的“卖铲人”,到底还能不能买?
01赚钱能力:简直就是印钞机
我们要看一家公司好不好,先看它赚不赚钱,怎么赚的钱。台积电的数据,只能用“恐怖”来形容。
1. 营收:创历史新高根据最新的2025年Q4数据,台积电单季营收干到了 337亿美元,同比增长超 20%! 这是什么概念?在全球经济还在复苏的时候,它跑出了百米冲刺的速度。这背后,全是AI 和高性能计算(HPC)的功劳。
2. 毛利率:62%!这才是最吓人的地方。做制造业的,通常赚的是辛苦钱,但台积电的毛利率高达62%。 这意味着什么?意味着它有着绝对的定价权。
3. 敢花钱,才敢赚钱。虽然赚得多,但台积电花钱也凶。预计2026年,为了建厂和研发2nm技术,它要砸进去 520亿-560亿美元。 这说明了什么?说明管理层极度看好未来,现在烧钱,是为了以后筑起更高的墙,让对手爬不进来。
02为什么要看多?逻辑很硬核
如果你问为什么看好台积电,理由就是不可替。
逻辑一:AI 时代的“独家水龙头”, 不管是 ChatGPT 还是自动驾驶,目前市面上所有最牛的 AI 芯片(英伟达、AMD、苹果),几乎 100% 都是台积电造的。 只要人类不停止发展 AI,台积电就是那个坐地收租的地主。
逻辑二:对手?一个能打的都没有,三星和英特尔虽然也在追赶,但在3nm 和即将到来的 2nm良率上,台积电依然遥遥领先。这不仅是技术优势,更是信任壁垒。
逻辑三:朋友圈太强大,看看它的客户名单:苹果、英伟达、高通……全是全球最有钱的科技巨头。这些大佬离不开台积电,这也保证了台积电的饭碗超级稳。
03风险在哪里?
地缘政治:这是房间里的大象。台海局势的一举一动,都会牵动股价。这是非市场因素,不可预测,也是压制台积电估值的最大原因。
现金流压力:刚才说了,一年砸500多亿美金建厂,这对现金流是个巨大的考验。如果宏观经济突然变冷,这些巨额投入可能会变成负担。
04总结:
现在的台积电,估值虽然不算“白菜价”,但考虑到它垄断级的地位,这个价格是合理的。它是半导体行业中,确定性最强的标的。考虑到地缘风险,不要一次性把子弹打光, 把它作为科技股的底仓配置,每当因为非基本面消息(比如政治新闻)导致股价大跌时,往往是最好的“捡带血筹码”的机会。
流水的科技巨头,铁打的台积电。在AI 的淘金热里,买把铲子防身,准没错。
The Australian Securities Exchange (ASX) is one of the world's top 20 exchanges, hosting over 2,000 listed companies worth approximately $2 trillion.
Quick Facts:
- The ASX operates as Australia's primary stock exchange, combining market trading, clearinghouse operations, and trade and payment settlement.
- It represents roughly 80% of the Australian equity market value through its flagship ASX 200 index.
- 2,000+ companies and 300+ ETFs are listed on the exchange, spanning from mining giants to tech innovators.
How does the ASX work?
The ASX combines three critical functions in one system.
As a market operator, it provides the electronic platform where buyers and sellers meet. Trading occurs through a sophisticated computer system that matches orders in milliseconds, replacing the traditional floor-based trading that once defined stock exchanges globally.
The exchange also acts as a clearinghouse, ensuring trades settle correctly. When you buy shares, the ASX guarantees the transaction completes, managing the transfer of securities and funds between parties.
Finally, it serves as a payments facilitator, processing the money flows that accompany each trade. This integrated approach reduces settlement risk and keeps the market running smoothly.
What are ASX trading hours?
The ASX operates from 10:00am to 4:00pm Sydney time (AEST/AEDT) on business days, with a pre-open phase from 7:00am.
Stocks open alphabetically in staggered intervals starting at 10:00am, followed by continuous trading until the closing auction at 4:00pm.
The exchange observes Australian public holidays and adjusts for daylight saving time between October and April, which can affect coordination with international markets.
Top ASX Indices
S&P/ASX 200
This is the exchange's flagship index. It tracks the 200 largest companies by market capitalisation and represents approximately 80% of Australia's equity market.
It serves as the primary benchmark for most investors and fund managers and is rebalanced quarterly to ensure it reflects the current market leaders.
All Ordinaries Index
Commonly called the All Ords, this index covers the top 500 companies on the ASX.
It provides broader market exposure than the S&P/ASX 200, capturing roughly 80-90% of total market value.
The 11 ASX sectors
The ASX also breaks down into 11 sector-specific indices, allowing investors to track performance in areas like financials, materials, healthcare, and technology.
These indices can help identify which parts of the Australian economy are strengthening or weakening.
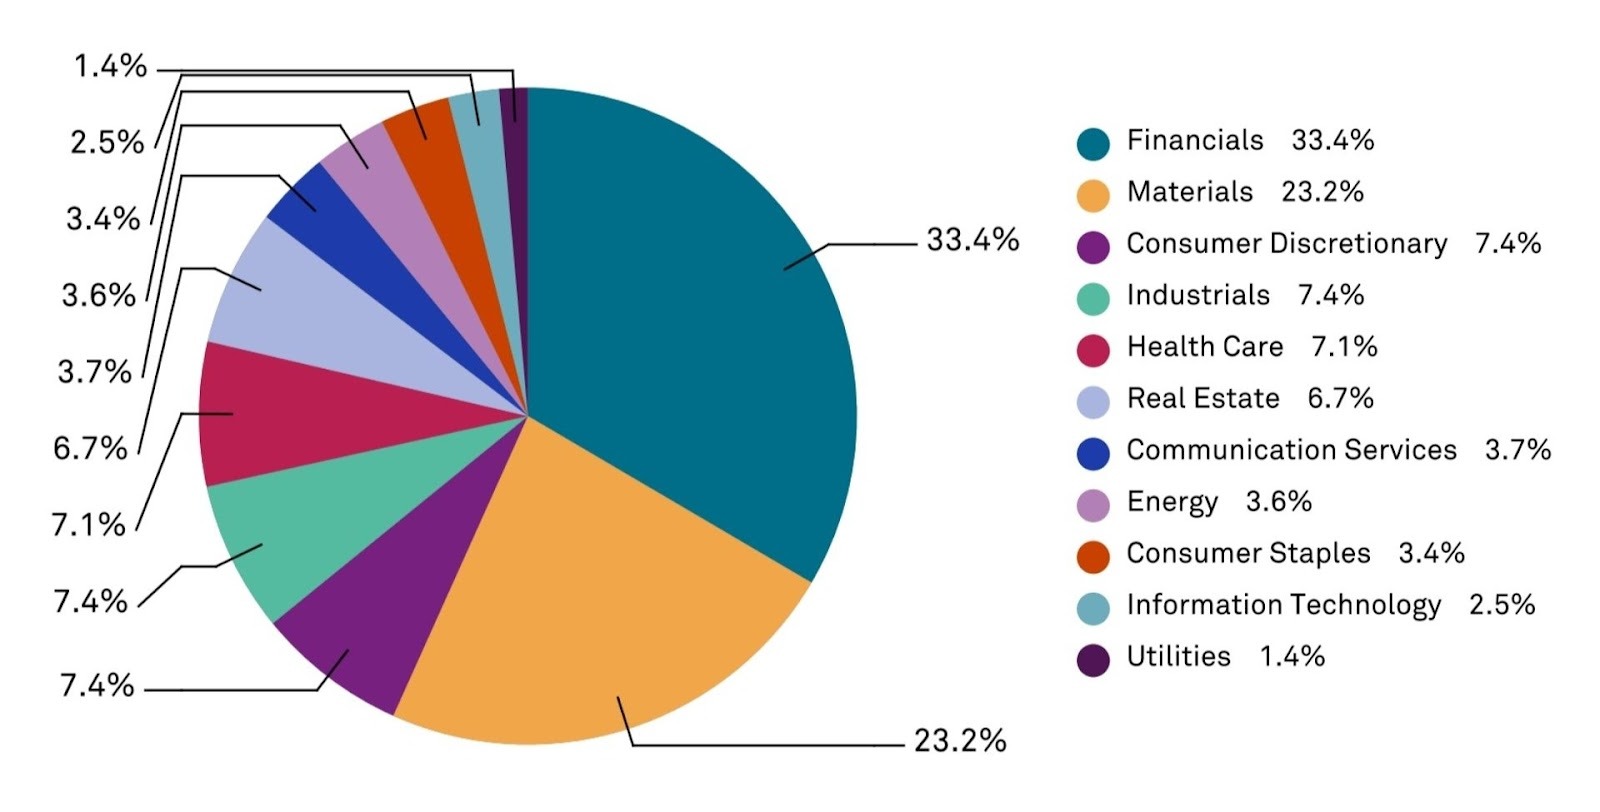
- Financials dominates as the largest sector, driven by Commonwealth Bank, NAB, Westpac, and ANZ. These banking giants provide lending, wealth management, and insurance services across Australia.
- Materials ranks second, led by mining powerhouses BHP and Rio Tinto. This sector extracts and processes resources, including iron ore, coal, copper, and gold.
- Consumer Discretionary includes retailers, media companies, and hospitality groups that benefit when household spending rises.
- Industrials encompasses construction firms, airlines, and professional services businesses.
- Healthcare features companies like CSL, a global biotech leader, and Cochlear, which produces hearing implants.
- Real Estate features property developers and Real Estate Investment Trusts (REITs) that own and manage commercial and residential assets.
- Communication Services includes telecommunications providers like Telstra alongside media and entertainment companies.
- Energy tracks oil and gas producers (many renewable energy companies typically fall under utilities).
- Consumer Staples covers essential goods providers like supermarkets and food producers.
- Information Technology includes software developers and IT services firms.
- Utilities covers electricity, gas, and water suppliers, including renewable energy.
Top ASX companies
Three companies consistently lead the S&P/ASX 200 by market capitalisation.
Commonwealth Bank (Mkt cap: A$259 bln)
Commonwealth Bank holds the top position on the ASX as Australia's biggest lender.
Founded in 1911 and fully privatised by 1996, CBA offers retail banking, business lending, wealth management, and insurance.
Its performance often signals the health of the domestic economy.
BHP Group (Mkt cap: A$241 bln)
BHP Group stands as the world's largest mining company.
Its diversified portfolio spans iron ore, copper, coal, and nickel operations globally.
It serves as a bellwether for Australian commodity markets.
CSL Limited (Mkt cap: A$182 bln)
CSL Limited leads the Australian healthcare sector as a global biotech firm.
Established in 1916, CSL develops treatments for rare diseases and manufactures influenza vaccines.
The company demonstrates Australian innovation competing on the world stage.
The ASX's role in Australia's economy
The ASX serves as a vital mechanism for capital formation in Australia. It tends to provide price signals that reflect market expectations.
When share prices rise, it suggests optimism about economic conditions. Falling markets may indicate concerns about future growth.
Australian companies raise funds through initial public offerings and follow-on share sales on the ASX, using proceeds to expand operations, fund research, or pay down debt.
Investors in these shares benefit from potential capital gains and dividend income. Many Australians build retirement savings through superannuation funds that invest heavily in ASX-listed companies.
Employment in financial services also depends partly on a healthy stock market. Brokers, analysts, fund managers, and supporting roles exist because of active capital markets.
Key takeaways
The ASX functions as a market operator, clearinghouse, and payments facilitator, providing the infrastructure that enables capital formation and supports retirement savings for millions of Australians.
Its flagship index, the S&P/ASX 200, tracks the 200 largest companies and captures about 80% of market capitalisation, while the All Ordinaries index covers the top 500.
Financials and Materials dominate the exchange, led by Commonwealth Bank, BHP, and CSL, reflecting Australia's strength in banking and resources.
You can trade the S&P/ASX 200 Index CFD and over 230 ASX Share CFDs on GO Markets.

US earnings season is where the market gets its cleanest burst of new information. For Australians, it usually lands while the country is asleep. This is not just “US company news”. It is the scoreboard for the Nasdaq, the S&P 500, and risk appetite more broadly, with spillover into SPI futures, the AUD, and sector mood at the ASX open.
What this guide covers
- The four-wave rhythm (why volatility clusters in predictable months)
- The order of play (banks → tech → retailers) and what each group tends to reveal
- Before market open (BMO) vs after market close (AMC)
- The few lines markets care about (surprise vs expectations, and the forward reset)
- How earnings information can flow through to Australia via futures, FX, and sector sentiment
US earnings season basics
Earnings season is the 4 to 6-week window after each quarter when most US-listed companies report a new set of numbers and a new story.
Calendar rhythm and clustering
Earnings does not arrive as a smooth drip. It typically arrives in four recurring waves. Most US reporting clusters around January, April, July, and October. Each wave covers the prior quarter, which is why markets spend the lead-up period building expectations, then reprice quickly as numbers and guidance hit.
The sequence is familiar: banks open, tech dominates the middle, retailers close. That order matters because each group updates a different part of the macro story. If you only track one set of reports, make it the Magnificent 7 — here’s the Mag 7 earnings calendar for 2026 (Aussie-friendly timing)
.png)
Time zones: the two windows
For Australians, the key is when the first move hits.
- AMC (after market close): often Sydney and Melbourne morning, sometimes near the ASX open
- BMO (before market open): often late night, with the initial reaction while Australia sleeps
Daylight saving shifts timings, but the structure is consistent: two windows, two different liquidity conditions.
How the market digests an earnings event
Earnings is rarely a single reaction. It is a sequence.
- Headline release (EPS and revenue versus consensus)
- Immediate price discovery (often in after-hours or pre-market liquidity)
- Call and Q&A (guidance, margins, and demand tone get tested)
- Next US cash session (follow-through, reversals, broader positioning)
- Australia opens into the aftershock (futures, FX, and sector mood already set)
Translation: volatility often clusters around reporting windows because the calendar can concentrate new information and repricing.
Expectations: the scoreboard the market uses
Markets do not price “good” or “bad” in isolation. They price the gap versus expectations, then adjust the forward story. That is why the same quarter can look strong on paper and still disappoint if it lands below what the market had already baked in.
Most headlines boil down to three checks. First, actual results versus consensus. Second, actual results versus what the company previously guided. Third, quality and durability. That tends to show up in margins, the mix across segments, and whether cash flow backs up the earnings number.
Guidance: the forward reset
Guidance is where the narrative can change without the quarter changing. A company can deliver the past cleanly, then move the goalposts for what comes next. That forward reset is often what drives the bigger repricing.
In practice, guidance usually lands in a few buckets. Revenue or EPS outlook sets the top-line and earnings path. Margin outlook tells you how confident management is about costs and pricing. Capex language signals how heavy the investment cycle is likely to be. Capital return talk, including buybacks, is a read on balance sheet posture and priorities.
Translation: markets trade forward narratives. Guidance is the mechanism.
The call: where tone becomes data
Prepared remarks are polished. The call is where the market stress-tests the story. The Q&A is where the edges show up, because that is where analysts push on the parts that matter and management has to answer in real time.
Listen for the tells. Demand language can shift from broad to patchy. Pricing can move from power to pressure. Margin confidence can sound steady or start to carry caveats. And the “we are not breaking that out” moments matter too. What management avoids can be as informative as what it highlights.
Key takeaways
- Earnings season clusters in four waves (January, April, July, October), so volatility often arrives in blocks.
- The sequence matters. Banks open the read on confidence, tech steers index tone, retailers often close the consumer chapter.
- From Australia, BMO and AMC are the two windows that shape what you wake up to.
- Markets trade surprise vs expectations, then the forward reset via guidance and call tone.
- The spillover typically shows up through futures, FX, and sector sentiment before the ASX open.
Glossary (quick definitions)
- EPS: earnings per share
- Consensus: the market’s compiled estimate set
- Guidance: management’s forward-looking outlook ranges/comments
- Margins: profitability as a percentage of revenue
- Capex: capital expenditure (investment spend)
- BMO/AMC: before market open / after market close (US reporting labels)
- After-hours / pre-market: trading sessions outside regular US cash hours
- Correlation: how tightly assets move together (often rises in macro or de-risking periods)
%20(1).jpg)
近期全球市场的核心变化,并非单一数据或单一事件,而是风险定价逻辑的再平衡。中东地缘局势反复、美伊关系阶段性紧张,使市场对潜在冲突的敏感度显著抬升。尽管美国方面释放出“局势可控”的安抚信号,短期恐慌有所缓解,但相关不确定性仍然牵动着全球资产配置方向。
更值得关注的是,在地缘风险背景下,中美经贸与科技层面的博弈出现新的变量。中国通过关税、反垄断监管及部分技术与网络安全层面的审查措施,释放出更为明确的政策信号。这种变化并未引发市场剧烈波动,但正在悄然改变板块间的相对强弱结构。
从美股表现来看,风险偏好出现阶段性回落。科技板块承压,三大股指集体收低,其中以科技权重较高的纳指跌幅相对靠前。与之形成对照的是,国防军工、关键矿产与资源相关板块获得资金青睐,反映出在不确定性上升阶段,市场更倾向于防御属性与战略资源方向。
政策层面,美国近期密集出台行政指令,围绕关键矿物供应、芯片应用场景及产业安全展开部署。与此同时,最高法院对部分贸易政策的裁决进程仍存在不确定性,也为市场预期留下想象空间。宏观数据方面,PPI阶段性反弹、褐皮书对经济与通胀的表述偏中性偏稳,使得市场对短期货币政策转向的预期进一步降温。
整体而言,当前市场并未进入系统性风险阶段,但“高估值成长 → 防御与资源”的轮动逻辑正在逐步显现,资金配置思路更趋谨慎,也更注重现实约束。