Academy
Academy

ซื้อขายในช่วงฤดูกาลประกาศผลประกอบการของสหรัฐฯ

ฤดูกาลประกาศผลประกอบการไตรมาสแรกปี 2026 อาจส่งผลกระทบต่อตลาดอย่างรวดเร็ว ติดตามผลประกอบการที่กำลังจะมาถึง วางแผนรายการหุ้นที่คุณสนใจ และซื้อขาย CFD หุ้นสหรัฐฯ ด้วยเครื่องมือที่สร้างขึ้นสำหรับนักลงทุนที่ซื้อขายอย่างสม่ำเสมอ

Most watched this season

Apple • Microsoft • Alphabet • Amazon • Nvidia • Meta • Tesla

ร่วมลงทุนในช่วงฤดูกาลประกาศผลประกอบการของสหรัฐฯ กับ GO Markets

ฤดูกาลประกาศผลประกอบการของสหรัฐฯ นำมาซึ่งการประกาศผลประกอบการครั้งใหญ่จากบริษัทจดทะเบียนขนาดใหญ่ของสหรัฐฯ ผลประกอบการ แนวทางการคาดการณ์ และความคาดหวังของตลาดสามารถเปลี่ยนแปลงได้อย่างรวดเร็ว ส่งผลให้เกิดความผันผวนในหุ้นรายตัว ภาคส่วนต่างๆ และดัชนีในวงกว้าง

ราคาที่แข่งขันได้

ควรระมัดระวังเรื่องต้นทุนเมื่อทำการซื้อขายในช่วงที่มีรายงานข่าวเปลี่ยนแปลงอย่างรวดเร็ว

เครื่องมือวิเคราะห์ทางเทคนิค

ใช้แผนภูมิและตัวชี้วัดเพื่อวางแผนการเข้าซื้อ การขายออก และการบริหารความเสี่ยง

สร้างขึ้นเพื่อการซื้อขายเชิงรุก

ซื้อขายด้วยการดำเนินการที่รวดเร็วและแพลตฟอร์มที่เชื่อถือได้

การควบคุมการบริหารความเสี่ยง

ใช้เครื่องมือในตัวเพื่อกำหนดความเสี่ยงขาลงและปกป้องตำแหน่งการลงทุนในช่วงที่มีความผันผวน

มีเวลามากขึ้นในการลงมือทำ

มีบริการขยายเวลาทำการสำหรับ CFD หุ้นสหรัฐฯ บางรายการ ทำให้คุณมีเวลาซื้อขายเพิ่มเติมมากกว่าเวลาทำการปกติของตลาด*

*ความพร้อมใช้งานอาจแตกต่างกันไปตามประเภทของเครื่องมือทางการเงิน เงื่อนไขการซื้อขายอาจแตกต่างกันไปนอกเวลาทำการปกติของตลาด

ผู้ชมมากที่สุดในฤดูกาลนี้

ปฏิทินผลประกอบการของสหรัฐอเมริกา

เวลาที่แสดงเป็นเวลามาตรฐานตะวันออกของออสเตรเลีย (GMT+10) คุณสามารถเปลี่ยนเขตเวลาของคุณได้ตลอดเวลาในการตั้งค่าปฏิทินรายได้

ข่าวและบทวิเคราะห์

US Earnings
AI
การป้องกัน การหยุดชะงัก และการเงินครั้งใหญ่: 3 ชื่อที่ควรค่าแก่การรับชมฤดูกาลนี้

นี่คือสิ่งที่: ฤดูกาลรายได้ของสหรัฐฯ ในเดือนเมษายนกำลังมาถึงตลาดที่ยังคงรู้สึกไม่ใช่เรื่องปกติดังที่ GO Markets อธิบายใน หนังสือเล่มรายได้ทั่วโลกของสหรัฐอเมริกา: คู่มือที่จำเป็นสำหรับผู้ค้าระยะเวลาการรายงานนี้กำลังลงมาหลังจากการเปลี่ยนแปลงที่แท้จริงในสิ่งที่ตลาดสนใจมันไม่ใช่แค่การไล่ตามการเติบโตด้วยค่าใช้จ่ายใด ๆ อีกต่อไปมันเกี่ยวกับสิ่งที่ตัวเลขพูดใต้พื้นผิว

และในปี 2026 สัญญาณเหล่านั้นกำลังชนกับฉากหลังที่มีแรงเสียดทานสูง:

  1. ความขัดแย้งทางภูมิศาสตร์ ความตึงเครียดอย่างต่อเนื่องในตะวันออกกลาง
  2. แรงกระแทกจ่ายน้ำมัน: น้ำมันดิบ Brent สูงกว่า 100 เหรียญสหรัฐ
  3. เฟด: ธนาคารกลางยังคงตกอยู่ในภาวะเงินเฟ้อที่เหนียวเหนียว

หมุนความทนทาน

ใช่ AI ยังคงเป็นเรื่องราวหลักของตลาด แต่ก็ยังคงเป็นเครื่องยนต์ที่ฉูดฉาดที่ได้รับความสนใจมากที่สุดแต่ภายใต้สิ่งนั้น มีการเคลื่อนไหวที่เงียบกว่าต่อบริษัทที่ดูถูกสร้างขึ้นเพื่อยึดมั่นได้ดีขึ้นเมื่อสภาพแย่ลง

เมื่ออัตราไม่แน่นอนและตลาดพลังงานอยู่ภายใต้แรงกดดัน ชื่ออย่าง JPMorgan Chase และผู้รับเหมาด้านการป้องกันรายใหญ่ก็เริ่มมีน้ำหนักมากขึ้นพวกเขาไม่ได้แทนที่การเล่าเรื่อง AI แต่พวกเขากำลังกลายเป็นส่วนหนึ่งของวิธีที่เทรดเดอร์อ่านความอยากความเสี่ยง ความทนทานต่อรายได้ และในท้ายที่สุดตลาดกำลังมองหาสิ่งที่มั่นคงมากขึ้นเพื่อยึดมั่นคง

! Important: Reporting schedules can change without notice. Reporting dates and release times are from company investor relations calendars where marked Confirmed; otherwise they are GO Markets estimates. Consensus EPS, revenue and analyst-range data are from third-party market consensus sources, as of 7 April 2026 (AEDT). Company guidance, backlog and operating metrics are from the latest company filings or results presentations unless stated otherwise. Figures and schedules may change without notice.
$JPM | Q1 2026 REPORTING PERIOD

JPMorgan Chase & Co.

NYSE | Financial Services | 14 Apr 2026
Confirmed

Global Release Countdown (BMO)

00:00:00:00
Consensus EPS
US$5.42
Consensus Revenue
US$47.88bn
AU/ASIA 14 Apr | 8:45 pm
US/LATAM 14 Apr | 6:45 am
Market Intelligence: $JPM

Analysis: JPM price drivers and scenarios

NII guidance
~US$103 billion
Full year | US$95 billionn ex:markets
ROTCE target
17%
Possible return on tangible common equity
Analyst range
US$5.02-5.70
Low to high estimate spread
AVG
LOW US$5.02 AVG US$5.39 HIGH US$5.70

The analyst spread of US$0.68 signals genuine disagreement about how the rate environment is flowing through to margins. A result above consensus but below the high end estimate may produce a muted reaction. A result above US$5.70 may shift the discussion.

Key swing factors for the result

Net interest income (NII)
The clearest macro lever. It reflects the gap between lending rates and deposit costs.
Guidance: US$103 billion for the full year
Return on tangible common equity (ROTCE)
A scale check. It indicates whether JPM is converting scale into efficiency. 17% is the benchmark.
Target: 17% ROTCE
Trading and investment banking
Strong Q1 growth was expected in fees and markets revenue. These lines can offset softness in lending, and stronger-than-expected performance here may shift the narrative away from rate sensitivity.
Watch: investment banking (IB) fees versus the prior quarter
Expense discipline
A bank can beat the EPS estimate and still sell off if expense growth is running too hot. Pairing the EPS result with the expense trajectory gives a fuller read on whether the beat is durable.
Watch: Expense outlook commentary
Trade Execution: $JPM

Earnings reaction framework: Q1 2026

Bull case
EPS above US$5.70, NII on track | ROTCE at or above 17%
The result comes in above the top of the analyst range. NII guidance holds or is revised higher. IB fees and markets revenue show strong Q1 growth. Expense commentary is constructive.
Possible reaction: momentum and repositioning
Base case
EPS between US$5.39 and US$5.70, NII in line | ROTCE near target
The result beats consensus but stays within the expected range. NII tracks guidance. The tone of the conference call may matter more than the headline number. The first move may fade if guidance is unchanged.
Possible reaction: muted or mixed initial response
Bear case
EPS below US$5.39 | NII misses | Expense growth surprises
The result comes in at or below the consensus midpoint. NII guidance is cut or qualified. Expense growth comes in above market expectations. IB or markets revenue disappoints.
Possible reaction: earnings multiple repricing

Reaction trigger to watch: The market response in the first 30 minutes after the result may indicate which scenario traders are leaning towards. A move above the prior session high on volume may support the bull case. A fade back into the range after an initial pop may point to the base case. A break below the prior session low on volume may suggest the bear case is gaining traction.

Sentiment Analysis · JPMorgan Chase

Interactive scenario analysis: $JPM

Select earnings outcome
Growth momentum

AI-linked offset, beat supported by NII and ROTCE

Stronger-than-expected demand for AI-related industrial lending may offset softer mortgage activity. Management maintains guidance as NII remains resilient in higher-for-longer conditions. IB fees and markets revenue may provide additional support. ROTCE at or above 17% would suggest the bank is converting scale into earnings efficiently.
EPS Outcome
Above US$5.70
NII Signal
On track
ROTCE
At or above 17%
Likely Reaction
Momentum may build

Sources & Data Methodology Sources: Reporting dates and release times are from company investor relations calendars where marked Confirmed; otherwise they are GO Markets estimates. Consensus EPS, revenue and analyst-range data are sourced from Bloomberg and Earnings Whispers, as at 7 April 2026 (AEDT). Company guidance, backlog and operating metrics are sourced from the latest company filings, results presentations or investor relations materials unless stated otherwise. Any scenario analysis reflects GO Markets analysis. Figures and schedules may change without notice.

From credit to defence

If JPMorgan gives the market an early read on the consumer, credit quality and business activity, the defence names may be telling a different story. This is the point where the focus may start to shift from the credit cycle to government-backed demand.

In a market still shaped by geopolitical risk, that matters. Long-dated programs can help support revenue visibility, even when the broader outlook looks less certain. That is one reason the sector remains on the watchlist.

$LMT | Q1 2026 REPORTING PERIOD

Lockheed Martin Corp.

NYSE | Aerospace | Defense | 22 Apr 2026
Estimated

Global Release Countdown (BMO)

00:00:00:00
Consensus EPS
US$6.50
Consensus Revenue
US$16.32bn
AU | ASIA 22 Apr | 9:20 pm
US | LATAM 22 Apr | 7:20 am
Market Intelligence: $LMT

Analysis: LMT price drivers and scenarios

Order backlog
US$194 billionn
Record visibility
Book-to-bill
1.2x
Orders outpacing sales
Analyst range
US$6.90-7.10
Low to high estimate spread
AVG
LOW ~US$6.90 AVG ~US$6.94 HIGH US$7.10+

The consensus sits near the lower end of the analyst range. That positioning may leave room for upside if backlog growth and F-35 delivery timelines support execution. A print near the high end, above US$7.10, may extend the move, although the reaction would still depend on guidance and margins.

Key swing factors for the result

Backlog visibility
Primary evidence of demand. Book-to-bill above 1.2x would support full-year guidance and the production ramp.
Backlog: US$194 billion record
Free cash flow (FCF)
Defence stocks are often assessed on cash conversion. The market may look for confirmation of the US$6.5 billion floor.
Guide: US$6.5 billion - $6.8 billion
Missile segment growth
PrSM and THAAD deliveries remain key watchpoints. Strong space margins may help offset softness in aeronautics.
Watch: Fire Control margins
Margin pressure
Pension charges and production inflation remain risks. An earnings beat may fade if operating margins contract.
Watch: segment operating margin
Trade Execution: $LMT

Earnings reaction framework: Q1 2026

Bull case
EPS above US$6.70, backlog visibility confirmed | FCF guide holds
The result clears the upper half of the analyst range. Management reaffirms or raises the full-year FCF outlook. Strong Missiles and Fire Control (MFC) margins help offset any aeronautics supply chain lag.
Possible reaction: momentum may build and positioning may improve
Base case
EPS between US$6.30 and US$6.70 | Backlog steady at about US$194 billion
The result aligns with the US$6.38 consensus. F-35 delivery pace remains on track but offers no meaningful upside surprise. The market may wait for more specific segment guidance on the conference call.
Possible reaction: muted or mixed initial response
Bear case
EPS below US$6.30 | FCF guide qualified, margin contraction
The result falls towards the bottom of the analyst spread. Management cites further software delays or program losses. The FCF trajectory narrows towards the lower end of previous expectations.
Possible reaction: the share price may come under pressure

Reaction trigger to watch: The market response in the first 30 minutes after the result may indicate which scenario traders are leaning towards. A move above the prior session high on volume may support the bull case. A fade back into the range after an initial pop may point to the base case. A break below the prior session low on volume may suggest the bear case is gaining traction.

Sentiment Analysis · Lockheed Martin

Interactive scenario analysis: $LMT

Select earnings outcome
Backlog confirmed

Backlog and FCF confirmation may support continuation

EPS clears the top of the analyst range. Backlog holds at or above US$194 billion and book-to-bill stays above 1.2, which would suggest orders are replenishing faster than revenue is being recognised. FCF guidance holds within the stated range.
EPS outcome
Above US$7.00
Backlog signal
Above US$194 billion
FCF guide
Holds or improves
Likely reaction
Continuation may follow

Sources & Data Methodology Sources: Reporting dates and release times are from company investor relations calendars where marked Confirmed; otherwise they are GO Markets estimates. Consensus EPS, revenue and analyst-range data are sourced from Bloomberg and Earnings Whispers, as at 7 April 2026 (AEDT). Company guidance, backlog and operating metrics are sourced from the latest company filings, results presentations or investor relations materials unless stated otherwise. Any scenario analysis reflects GO Markets analysis. Figures and schedules may change without notice.

Not all defence names are the same

Lockheed Martin and Northrop Grumman may sit in the same defence bucket, but the market does not always read them the same way. Lockheed is more closely tied to the F-35 and current air combat demand. Northrop is more closely linked to next-generation programs such as the B-21 Raider and Sentinel.

That gives this section its contrast. One is often read through the lens of current defence demand. The other is more closely tied to longer-cycle strategic modernisation.

$NOC | Q1 2026 REPORTING PERIOD

Northrop Grumman Corp.

NYSE | Defense | Space Systems | 23 Apr 2026
Estimated

Global Release Countdown (BMO)

00:00:00:00
Consensus EPS
US$6.12
Consensus Revenue
US$10.24 bn
AU | ASIA 23 Apr | 10:30 pm
US | LATAM 23 Apr | 8:30 am
Market Intelligence: $NOC

Analysis: NOC price drivers and scenarios

Consensus EPS
US$6.96
Quarterly analyst average
Order Backlog
US$95.7 bn
Record revenue visibility
FY 2026 EPS guide
US$27.40-US$27.90
Full-year 2026 outlook
AVG
LOW ~US$6.90 AVG ~US$6.96 HIGH US$7.20+

The consensus sits near the lower end of the analyst range. That offers a quick visual for whether the result is merely in line or strong enough to ease the guidance concerns that weighed on the stock after its last update. A result above US$7.20 may shift the conversation more materially.

Key swing factors for the result

Book-to-bill ratio
Currently at 1.10, suggesting orders are still running ahead of revenue recognition. This remains an important signal for multi-year growth visibility in defence.
Watch: 1.10 target
Guidance reset risk
Management’s guidance previously came in below market expectations. The market may be sensitive to any further softening in the 2026 outlook.
Watch: guidance commentary
Program concentration
The B-21 Raider and Sentinel carry outsized execution sensitivity. Updates on production ramp and funding may be the clearest drivers of sentiment for the stock.
Watch: B-21 and Sentinel updates
Capacity investment
Higher capital expenditure (capex) supports the industrial base over the longer term, but it may pressure near-term margins. Watch for signs that current investment is weighing on earnings power.
Watch: operating margins
Trade Execution: $NOC

Earnings reaction framework: Q1 2026

Bull case
EPS above US$6.30, backlog expansion above US$96 billion | Free cash flow (FCF) guidance raised
The result comes in above the cited threshold. Management says B-21 Raider production is ahead of schedule, with improving margins. Sentinel program restructuring costs remain below baseline expectations. International awards lift the book-to-bill ratio above 1.15.
Possible reaction: momentum may improve
Base case
EPS between US$6.00 and US$6.20, backlog steady at about US$95.7 billion
The result is broadly in line with the cited range. FCF targets for 2026 are reaffirmed but not expanded. Market focus shifts to organic sales growth metrics and segment operating margins. The initial reaction may depend on the timing of B-21 milestone payments.
Possible reaction: little reaction
Bear case
EPS below US$5.95 | margin pressure, guidance narrowed
The result lands near the low end of the analyst spread. Management flags higher infrastructure costs for Sentinel or delays in restricted space segment awards. Margin pressure in Aeronautics persists, and the 2026 revenue guide narrows towards the US$43.5 billion floor.
Possible reaction: shares may weaken

Reaction trigger to watch: The market response in the first 30 minutes after the result may indicate which scenario traders are leaning towards. A move above the prior session high on volume may support the bull case. A fade back into the range after an initial pop may point to the base case. A break below the prior session low on volume may suggest the bear case is gaining traction.

Sentiment Analysis · Northrop Grumman

Interactive scenario analysis: $NOC

Select earnings outcome
Stealth momentum

B-21 momentum, stronger execution and FCF support

EPS clears US$6.15. Management confirms a production capacity agreement for the B-21 Raider. Sentinel restructuring reaches Milestone B on schedule. Record backlog visibility and higher FCF guidance towards US$3.5 billion may support broader repositioning.
EPS outcome
Above US$6.15
B-21 Signal
Acceleration
FCF guide
$3.5 billionn range
Likely reaction
Momentum rally

Sources & Data Methodology Sources: Reporting dates and release times are from company investor relations calendars where marked Confirmed; otherwise they are GO Markets estimates. Consensus EPS, revenue and analyst-range data are sourced from Bloomberg and Earnings Whispers, as at 7 April 2026 (AEDT). Company guidance, backlog and operating metrics are sourced from the latest company filings, results presentations or investor relations materials unless stated otherwise. Any scenario analysis reflects GO Markets analysis. Figures and schedules may change without notice.

Bottom line

In a market shaped by geopolitical risk and shifting rate expectations, companies with visible demand and longer-cycle revenue may continue to attract attention. But sentiment can still turn quickly if valuations are stretched, rate expectations shift again, or tensions in the Middle East ease.

That is why the story still needs to be tested against the numbers, not just the narrative. GO Markets will be analysing more companies throughout this earnings season. For more updates, visit our earnings page, follow our social media channels, or check the weekly newsletters.

Your next earnings setup starts here

Stay ahead of major beats, misses, and market surprises. Log in to your terminal, open a new account, or explore our dedicated earnings academy.

Need help? Contact our support team

GO Markets
April 7, 2026
US Earnings
AI
หนังสือเล่มรายได้ทั่วโลกของสหรัฐอเมริกา: คู่มือที่จำเป็นสำหรับผู้ค้า

หากคุณเฝ้าระวังตลาดในช่วงหนึ่งปีที่ผ่านมา คุณจะสังเกตเห็นว่ายุค “การเติบโตด้วยค่าใช้จ่ายใดก็ได้” ได้กระทบกำแพงอย่างมีประสิทธิภาพวงจรรายได้เดือนเมษายน 2026 มาถึงช่วงเวลาที่โฟกัสของตลาดได้รับการปรับเปลี่ยนโครงสร้างแล้วมันไม่ใช่แค่เรื่องงบกำไรขาดทุนอีกต่อไปมันเกี่ยวกับสัญญาณที่นั่งอยู่ด้านหลังพวกเขา

เนื่องจากความไม่แน่นอนในอัตราดอกเบี้ยยังคงอยู่และแรงกระแทกทางภูมิศาสตร์ที่ผลักดันน้ำมันสูงกว่า 100 ดอลลาร์สหรัฐ หนังสือเล่มนี้ได้เปลี่ยนจาก AI hype ไปสู่ความยืดหยุ่นของสถาบันและการคำนวณเป็นอุตสาหกรรมสำหรับเทรดเดอร์ในออสเตรเลีย เอเชีย และละตินอเมริกา ผลลัพธ์เหล่านี้อาจทำหน้าที่เป็นวงแหวนสำหรับความอยากเสี่ยงทั่วโลกและซูเปอร์ไซเคิลด้านความปลอดภัยที่เกิดขึ้นใหม่

Important - Dates, Times and Figures

All earnings dates marked as confirmed or estimated should be verified against current company investor relations calendars before you act on them. Reporting schedules can change without notice due to corporate decisions, regulatory requirements or exchange timetable adjustments.

The mechanics: How the timing works across time zones

The US earnings season does not arrive as a smooth drip. It arrives in waves. For non-US traders, the primary challenge is the overnight gap: major results land while you are away from your desk and can move index CFDs before your local market opens. Before market open (BMO) and after market close (AMC) matter just as much as the numbers themselves. The timing changes how quickly markets react, when liquidity is available and whether the first move has already happened before your session begins.

ทำไม BMO และ AMC จึงสำคัญ

ผลลัพธ์ BMO เกิดขึ้นก่อนที่ตลาดเงินสดของสหรัฐอเมริกาจะเปิดขึ้น ดังนั้นการค้นพบราคาจึงเกิดขึ้นในการซื้อขายก่อนตลาดซึ่งสภาพคล่องน้อยลงและการเคลื่อนไหวอาจเกินจริงผลลัพธ์ AMC จะเกิดขึ้นหลังจากปิด ซึ่งหมายความว่าปฏิกิริยาจะถูกบีบอัดเข้าสู่หน้าต่างก่อนการตลาดสั้น ๆ ในเช้าวันรุ่งขึ้นการทำความเข้าใจว่าบริษัทของคุณรายงานในหน้าต่างใดมีความสำคัญเท่ากับการทำความเข้าใจสิ่งที่รายงาน

Institutional Grade Performance

Master the Markets with MetaTrader 5

Trade hundreds of instruments with superior speed and advanced technical analysis. Harness full EA functionality to execute your strategy.

Need to access your terminal? Log in to Client Portal

The key themes for Q1

For this cycle, the market is no longer rewarding AI mentions alone. It is looking for return on investment (ROI) proof. The four thematic snapshots below help explain where attention is likely to sit as results come through. Each theme has its own section with company cards that can be updated each quarter.

T1
Theme 1 — Institutional anchors

Defence against volatility

These companies are often watched as relative defensives during energy shocks and inflation spikes, although they remain exposed to normal share-price risk. When macro uncertainty rises, money has historically rotated toward businesses with contracted revenue, government-linked demand or pricing power that is not dependent on the consumer cycle — but past rotation patterns do not guarantee future performance.

JPM
JPMorgan Chase
Tuesday, 14 April Confirmed
Watch For

Net interest margin (NIM) under higher for longer rates, and whether AI spending remains cost neutral.

LMT
Lockheed Martin
Wednesday, 22 April Estimated
Watch For

F-35 delivery schedules and the company's ability to absorb tariff related costs on supply chain inputs.

NOC
Northrop Grumman
Monday, 27 April Confirmed
Watch For

B-21 Raider production progress and the conversion of its reported US$95.7 billion backlog into recognised revenue.

T2
Theme 2 — Tangible capital

EVs and energy

As parts of tech slow, investors have been rotating toward tangible, capital-intensive businesses. The energy transition and the infrastructure required to support AI data centre power demand have put utilities and energy companies in an unusual position: they are now growth stocks with defensive characteristics — though all remain subject to ordinary equity and sector risk.

TSLA
Tesla
Thursday, 23 April Confirmed
Watch For

The strategic shift from EV margins toward robotaxi and energy storage as the new growth narrative.

NEE
NextEra Energy
Friday, 24 April Estimated
Watch For

Data centre power demand and progress on its reported 30 GW contracted backlog as utilities face new infrastructure pressure.

XOM
Exxon Mobil
Wednesday, 29 April Estimated
Watch For

Permian and Guyana volume growth, and cash flow resilience during the Hormuz supply disruption.

T3
Theme 3 — The hardware invoice phase

AI infrastructure

This is the engine room of the S&P 500 and the part of the market most tied to whether AI capital expenditure is generating measurable returns. The question the market is now asking is not whether these companies are spending on AI. It is whether the spending is translating into capacity utilisation and revenue that justifies the multiple.

MSFT / GOOGL
Microsoft and Alphabet
Monday, 27 April Estimated
Watch For

Azure and Cloud capacity constraints against heavy AI capital expenditure. The gap between spending and utilisation is the market's primary concern.

NVDA
NVIDIA
Wednesday, 27 May Estimated
Watch For

Blackwell GPU demand and gross margin sustainability as the product cycle matures and competition intensifies.

T4
Theme 4 — K-shaped recovery

Consumer platforms and devices

This theme tests the K-shaped consumer recovery: higher-income cohorts remain more resilient while lower-income cohorts face continued pressure from elevated borrowing costs and energy prices. Ad revenue and device upgrade cycles are the clearest indicators of where on the K-curve the consumer sits.

META / AMZN
Meta and Amazon
28 to 29 April Estimated
Watch For

AI-driven ad click improvements against Reality Labs spending and retail logistics costs as the profitability test for non-core investment.

AAPL
Apple
Thursday, 30 April Estimated
Watch For

iPhone upgrade cycle momentum and the Apple Intelligence rollout in China as the first real-world test of AI-driven hardware demand.

Analysis checklist: how to read each result

Use this structure for every company on your watchlist. A headline beat is common. The bigger market move often comes from how the market translates the details sitting behind the number.

1
Projected consensus

This is the bar for earnings per share (EPS) and revenue. Small beats may already be priced in. The market often sets a whisper number above the published consensus, so a technically positive result can still disappoint.

2
The call focus

Identify the single variable analysts are most focused on this cycle: capital expenditure versus margins, inventory turnover, customer growth rate, or contract backlog conversion.

3
The translation

A beat, meet or miss each carries a different market dynamic.

Beat Matters most when forward guidance is credible. Without it, the initial move may reverse.
Meet Often shifts focus to the tone of the call, particularly language around capacity or outlook.
Miss Can be treated as the start of a trend and trigger a sharp repricing of valuation multiples.

The recency bias problem

The emotional trap many traders fall into is recency bias. Because the Magnificent 7 have led markets for so long, it can feel as though they are still the only trade that matters. That assumption deserves to be tested.

มันคุ้มค่าที่จะถาม: การซื้อขายที่ชัดเจนมีราคาที่สมบูรณ์แบบแล้วหรือไม่?

ปี 2026 กำลังกลายเป็นปีแห่งการพิสูจน์บริษัทที่ใช้จ่ายไปกับ AI อย่างมากในช่วงสองปีที่ผ่านมาถูกขอให้แสดงผลตอบแทนตลาดไม่ให้รางวัลกับการประกาศการลงทุน AI อีกต่อไปเป็นการให้รางวัลหลักฐานของผลลัพธ์รายได้ที่ขับเคลื่อนด้วย AI

คำถามกรอบที่ดีกว่าสำหรับแต่ละผลลัพธ์คือ: คุณตอบสนองต่อหัวเรื่องหรือคุณกำลังประเมินบทบาทของ บริษัท ในห่วงโซ่อุปทาน AI ทางกายภาพหรือเป็นการป้องกันความผันผวนที่อาจเกิดขึ้นหรือไม่?งานเหล่านี้เป็นงานวิเคราะห์ที่แตกต่างกันมาก และพวกเขามักจะสร้างการตัดสินใจในการกำหนดตำแหน่งที่แตกต่างกันมาก

What to watch next

Three time horizons, three distinct signals. Update these each cycle with the most relevant near-term catalyst, the sector rotation to watch, and the longer-horizon dispersion theme.

Next Two Weeks
Consumer health barometer

Watch the 31 March Nike report as a lead indicator for consumer discretionary health. Footwear and apparel demand signals tend to front-run broader retail sentiment.

Next 30 Days
Bank lending and industrial demand

Focus shifts to the major banks. If loan demand tied to industrial and infrastructure projects remains firm, the earnings cycle may have support beyond the tech sector.

Next 60 Days
Wider dispersion between winners and losers

Watch for dispersion to widen. The companies converting heavy capital expenditure into measurable revenue outcomes may separate clearly from those that cannot.

Client & Education Portal

Follow the US Reporting Season

Stay ahead of major beats, misses, and market surprises. Log in to your terminal, open a new account, or explore our dedicated earnings academy.

Need help? Contact our support team

GO Markets
March 31, 2026
US Earnings
Market insights
NVIDIA Corporation (NVDA): แนวโน้มรายได้ของสหรัฐฯ

วันที่คาดว่าจะได้รับรายได้: วันพุธที่ 25 กุมภาพันธ์ 2026 (สหรัฐอเมริกาหลังจากปิดตลาด)/~ 8:00 น., วันพฤหัสบดีที่ 26 กุมภาพันธ์ 2026 (AEDT)

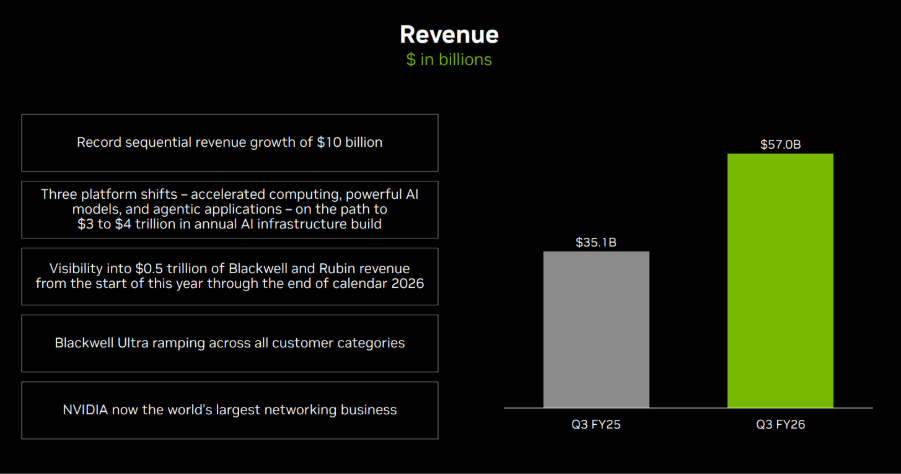
การเปิดตัวรายได้ที่กำลังจะมาถึงของ NVIDIA คาดว่าจะหมุนเวียนกับการเติบโตของรายได้จากศูนย์ข้อมูล ความยั่งยืนของความต้องการที่เกี่ยวข้อง AI วิถีมาร์จิ้นรวม และแนวทางแนวทางการดำเนินงานในปีงบประมาณ 2027 (FY2027)

ตลาดมีแนวโน้มที่จะมุ่งเน้นไปที่แนวโน้มการใช้จ่ายเงินทุน ความสามารถในการจัดหา และแนวโน้มโครงสร้างพื้นฐาน AI ของฝ่ายจัดการ

ผู้เข้าร่วมตลาดบางคนอาจมองผลลัพธ์ของ NVIDIA เป็นสัญญาณที่มีประโยชน์สำหรับความเชื่อมั่นในการลงทุนที่เกี่ยวข้อง AI ที่กว้างขึ้น แม้ว่าผลลัพธ์ยังคงได้รับอิทธิพลจากปัจจัยเฉพาะของ บริษัท และสภาพตลาดที่กว้างขึ้น

พื้นที่สำคัญที่มุ่งเน้น

ศูนย์ข้อมูล (ชิป AI)

กลุ่มศูนย์ข้อมูลยังคงเป็นตัวขับเคลื่อนการเติบโตหลักของ NVIDIAตลาดมีแนวโน้มที่จะติดตามอัตราการเติบโตของรายได้ อัตรากำไรขั้นต้น และแนวทางเกี่ยวกับความต้องการตัวเร่งอัจฉริยะ AI

การเล่นเกม

NVIDIA ยังขายกราฟิกการ์ดสำหรับพีซีสำหรับเล่นเกมตลาดจะดูว่าส่วนนี้ของธุรกิจยังคงมั่นคงและทำกำไรได้หรือไม่ โดยเฉพาะอย่างยิ่งควบคู่ไปกับแนวโน้มของผู้บริโภคและวงจรพีซีที่กว้างขึ้น

การแสดงภาพยานยนต์และระดับมืออาชีพ

เหล่านี้เป็นแผนกขนาดเล็กที่เชื่อมโยงกับการพัฒนา AI ซอฟต์แวร์ออกแบบและการขับขี่อัตโนมัติโดยปกติแล้วพวกเขาไม่ใช่ตัวขับเคลื่อนหลักของผลลัพธ์ระยะสั้น แต่อาจมีการตรวจสอบความคิดเห็นเพื่อดูสัญญาณของการเติบโตในระยะยาวและโมเมนตัมของผลิตภัณฑ์

อัตรากำไรและต้นทุน

ตลาดจะประเมินว่าNVIDIA ยังคงทำกำไรได้เพียงใด โดยเฉพาะอย่างยิ่งเนื่องจากการลงทุนที่เกี่ยวข้องกับ AI และการปรับขนาดอุปทานยังคงดำเนินต่อไปอัตรากำไรเป็นปัจจัยหนึ่งที่ติดตามอย่างใกล้ชิดควบคู่ไปกับการเติบโตของรายได้ แนวทาง และความเชื่อมั่นความเสี่ยงที่กว้างขึ้น

เกิดอะไรขึ้นไตรมาสที่แล้ว

ในการอัปเดตรายไตรมาสล่าสุด NVIDIA รายงานการเติบโตของรายได้ที่แข็งแกร่งเมื่อเทียบเป็นรายปี ซึ่งนำไปสู่ความต้องการของศูนย์ข้อมูลเป็นหลัก

ความคิดเห็นของผู้บริหารและการรายงานในภายหลังอ้างอิงถึงความแข็งแกร่งอย่างต่อเนื่องในความต้องการตัวเร่งของ AI และอ้างถึงความคิดริเริ่มการปรับขนาดอุปทานอย่างต่อเนื่อง

ไฮไลท์ที่สำคัญของรายได้ล่าสุด

  • รายได้: 57.0 พันล้านเหรียญสหรัฐ
  • กำไรต่อหุ้น (EPS): $1.30 (เจือจาง)
  • รายได้ของศูนย์ข้อมูล: 51.2 พันล้านเหรียญสหรัฐ
  • อัตรากำไรขั้นต้น: 73.4%
  • รายได้จากการดำเนินงาน: 36.0 พันล้านเหรียญสหรัฐ
รายได้ของ NVIDIA ไตรมาสที่ 3 FY25 - ไตรมาสที่ 3 FY26 | การนำเสนอนักลงทุน NVIDIA

สิ่งที่นักวิเคราะห์คาดหวังในไตรมาสนี้

การประมาณการที่เห็นด้วยกันของ Bloomberg ชี้ให้เห็นถึงการเติบโตของรายได้ต่อปีต่อปีอย่างต่อเนื่องในรายงานที่กำลังจะมาถึง โดยตลาดมุ่งเน้นไปที่ประสิทธิภาพของศูนย์ข้อมูลและแนวทางด้านการดำเนินงานในปีงบประมาณ 2027

จุดอ้างอิงฉันทามของ Bloomberg:

  • อีพีเอส: ประมาณ US$1.52
  • รายได้: ประมาณ 65.5 พันล้านเหรียญสหรัฐ
  • EPS ประจำปี FY2027: ประมาณ 7.66 เหรียญสหรัฐ

*ประเด็นข้างต้นทั้งหมดสังเกตเมื่อวันที่ 16 กุมภาพันธ์ 2026

นักวิเคราะห์คาดหวังอย่างกว้างขวางความต้องการที่เกี่ยวข้อง AI อย่างยั่งยืน ในขณะที่ยังคงให้ความสนใจไปที่พลวัตของอุปทานและความเร็วของการปรับสภาพอุปสงค์ให้เป็นปกติ

ความคาดหวังโดยนัยของตลาด

ตัวเลือกที่ระบุไว้มีการกำหนดราคาซึ่งเป็นการเคลื่อนไหวที่บ่งชี้ประมาณ ± 7% ถึง ± 8% รอบการเปิดตัวรายได้ โดยอิงจากการประมาณการการเคลื่อนไหวที่คาดหวังโดยนัยของตัวเลือก at-the-money (ATM) ที่มีวันที่ใกล้เคียงกันความผันผวนโดยนัยอยู่ที่ประมาณ 48% รายปี.

สิ่งนี้หมายความว่าอย่างไรสำหรับนักลงทุนชาวออสเตรเลีย

รายได้ของ NVIDIA อาจมีอิทธิพลต่อความเชื่อมั่นในระยะใกล้และความผันผวนในดัชนีหุ้นหลักของสหรัฐฯ รวมถึง NASDAQ 100 โดยอาจมีการแพร่กระจายไปในเซสชันเอเชียหลังจากการเปิดตัว

นอกจากนี้ยังอาจมีอิทธิพลต่อความเชื่อมั่นต่อบริษัทที่เปิดเผยเทคโนโลยีที่จดทะเบียน ASX และ ETF ที่เปิดเผยต่อภาคการเติบโตของมูลค่าสูงของสหรัฐฯ แม้ว่าความสัมพันธ์สามารถเปลี่ยนแปลงได้อย่างรวดเร็วตามเหตุการณ์สำคัญก็ตาม

นักลงทุนในออสเตรเลียอาจต้องการพิจารณาด้วย การเคลื่อนไหวของสกุลเงิน AUD/USDซึ่งอาจส่งผลต่อการแปลสกุลเงินท้องถิ่นของหุ้นนอกชายฝั่งและ ETF

หมายเหตุความเสี่ยงที่สำคัญ

ทันทีหลังจากปิดตลาดสหรัฐฯ และเข้าสู่ช่วงต้นของเซสชันเอเชีย ฟิวเจอร์สของ Nasdaq 100 (NDX) และการกำหนดราคา CFD ที่เกี่ยวข้องสามารถสะท้อนสภาพคล่องที่ลดลง สเปรดที่กว้างขึ้น และการปรับราคาที่คมชัดขึ้นตามข้อมูลใหม่

สภาพแวดล้อมดังกล่าวสามารถเพิ่มความเสี่ยงของช่องว่างและความไม่แน่นอนในการดำเนินการเมื่อเทียบกับเงื่อนไขชั่วโมงปกติ

Mike Smith
February 17, 2026
US Earnings
Market insights
Alphabet Inc. (GOOGL): แนวโน้มรายได้ของสหรัฐฯ

วันที่รายได้ที่คาดหวัง: วันพุธที่ 4 กุมภาพันธ์ 2026 (สหรัฐอเมริกา หลังจากปิดตลาด)/~ 8:00 น., วันพฤหัสบดีที่ 5 กุมภาพันธ์ 2026 (AEDT)

รายได้ของ Alphabet ให้ข้อมูลเชิงลึกเกี่ยวกับความต้องการโฆษณาดิจิทัลทั่วโลก การใช้จ่ายบนคลาวด์ขององค์กร และแนวโน้มการลงทุนในภาคเทคโนโลยีที่กว้างขึ้น

เนื่องจาก Google Search และ YouTube ถูกนำมาใช้กันอย่างแพร่หลายโดยทั้งผู้บริโภคและธุรกิจ ผลลัพธ์มักจะใช้เป็นอินพุตเดียวในการประเมินกิจกรรมออนไลน์และงบประมาณการตลาดขององค์กรควบคู่ไปกับตัวชี้วัดอื่นๆ

พื้นที่สำคัญที่มุ่งเน้น

ค้นหา

การโฆษณาค้นหายังคงเป็นตัวขับเคลื่อนรายได้ที่ใหญ่ที่สุดของ Alphabetตลาดมีแนวโน้มที่จะมุ่งเน้นไปที่อัตราการเติบโตของโฆษณา ตัวชี้วัดราคา เช่น ต้นทุนต่อคลิก และความต้องการของผู้โฆษณาโดยรวมในทุกภาคส่วน เช่น การค้าปลีก การเดินทาง และธุรกิจขนาดเล็กถึงขนาดกลาง

ยูทูบ

YouTube มีส่วนช่วยในการโฆษณาและรายได้จากการสมัครสมาชิกตลาดมักจะตรวจสอบโมเมนตัมการโฆษณา แนวโน้มการมีส่วนร่วม และการพัฒนาการสร้างรายได้เป็นตัวบ่งชี้สภาพสื่อดิจิทัลและการใช้จ่ายของแบรนด์

กูเกิลคลาวด์

ความสามารถในการทำกำไรแบบยั่งยืนบนคลาวด์มักถูกกล่าวถึงเป็นปัจจัยที่อาจส่งผลต่อความคาดหวังรายได้ในระยะยาว แม้ว่าผลลัพธ์ยังคงไม่แน่นอนตลาดคาดว่าจะมุ่งเน้นไปที่การเติบโตของรายได้แนวโน้มการนำไปใช้ขององค์กร และอัตรากำไรจากการดำเนินงาน

การเดิมพันอื่น ๆ

ความคิดริเริ่ม เช่น การขับขี่แบบอิสระและวิทยาศาสตร์ชีวิต ในขณะที่โดยทั่วไปแล้วผู้มีส่วนร่วมรายได้น้อยกว่า แต่ตลาดอาจยังคงดูระดับการใช้จ่ายและการอัปเดตความคืบหน้าเป็นตัวบ่งชี้การจัดสรรเงินทุนและวินัยด้านต้นทุน

กรอบต้นทุนและมาร์จิ้น

ก่อนหน้านี้ฝ่ายบริหารได้ระบุตำแหน่งสูงที่เชื่อมโยงกับโครงสร้างพื้นฐาน AI รวมถึงศูนย์ข้อมูล ชิปพิเศษ และความสามารถในการประมวลผลต้นทุนการได้มาซึ่งการจราจร ระดับพนักงาน และการขยายโครงสร้างพื้นฐานยังเป็นตัวแปรสำคัญที่มีอิทธิพลต่อการทำกำไร

เกิดอะไรขึ้นไตรมาสที่แล้ว

การอัปเดตรายไตรมาสล่าสุดของ Alphabet เน้นแนวโน้มการโฆษณา ความสามารถในการทำกำไรบนคลาวด์ และการเพิ่มขึ้นอย่างต่อเนื่องของ capex เพื่อสนับสนุนความคิดริเริ่ม AI

ความคิดเห็นของฝ่ายบริหารระบุว่าการใช้จ่ายโครงสร้างพื้นฐานมีจุดมุ่งหมายเพื่อสนับสนุนการแข่งขันในระยะยาว ในขณะที่ตลาดยังคงประเมินการแลกเปลี่ยนมาร์จิ้นระยะใกล้

ไฮไลท์ที่สำคัญของรายได้ล่าสุด

สำหรับตัวเลขที่รายงานและรายละเอียดกลุ่มจากไตรมาสล่าสุด โปรดดูที่เอกสารเผยแพร่รายได้ล่าสุดของ Alphabet รวมถึงรายได้ กำไรต่อหุ้น (EPS) การผสมผสานบริการรายได้จากการดำเนินงานบนคลาวด์ และข้อคิดเห็น capex

  • รายได้: 102.35 พันล้านเหรียญสหรัฐ
  • อีพีเอส: 2.87 เหรียญสหรัฐ
  • รายได้จากการดำเนินงาน: 31.23 พันล้านเหรียญสหรัฐ
  • รายได้จากบริการ: 87.05 พันล้านเหรียญสหรัฐ
  • รายได้จากคลาวด์: 15.16 พันล้านเหรียญสหรัฐ

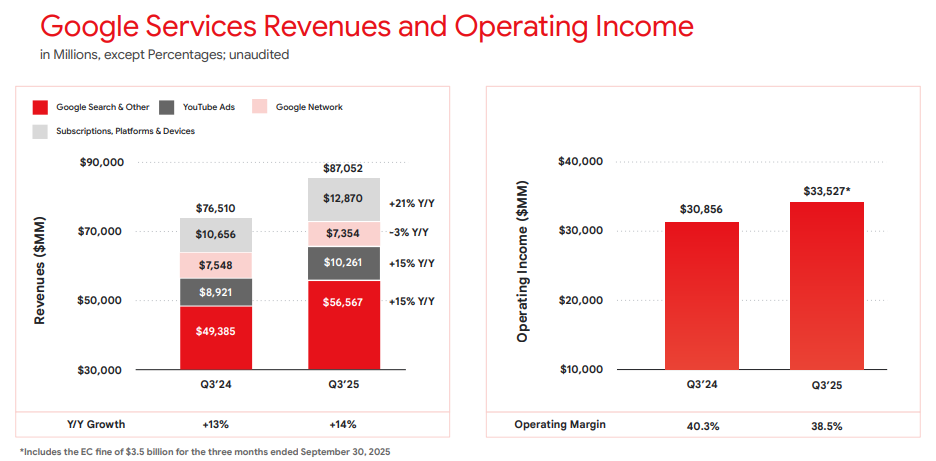
รายได้จากบริการของ Google และรายได้จากการดำเนินงาน ไตรมาสที่ 3 2025 | การเปิดตัวรายได้ของ Alphabet

สิ่งที่คาดหวังในไตรมาสนี้

ฉันทามติของ Bloomberg ประมาณการเติบโตของรายได้ในระดับปานกลาง (YoY) และ EPS ที่สูงขึ้นเมื่อเทียบกับไตรมาสปีก่อนหน้า โดยมุ่งเน้นไปที่อัตรากำไรจากการดำเนินงานอย่างต่อเนื่องเนื่องจากการลงทุนที่เกี่ยวข้อง AI

จุดอ้างอิงฉันทามติของ Bloomberg:

  • อีพีเอส: ช่วงต่ำถึงปานกลาง $2
  • รายได้: สูงถึง 80 พันล้านเหรียญสหรัฐถึงต่ำกว่า 90 พันล้านเหรียญสหรัฐ
  • คาเพ็กซ์: คาดว่าจะยังคงสูงขึ้น

*ประเด็นข้างต้นทั้งหมดสังเกตเมื่อวันที่ 31 มกราคม 2026

ความคาดหวังโดยนัยของตลาด

ตัวเลือกที่ระบุไว้หมายถึงการเคลื่อนไหวที่คาดหวังไว้ประมาณ ± 4% ถึง ± 6% ในช่วงหน้าต่างหมดอายุใกล้เคียงที่เกี่ยวข้องการเคลื่อนไหวที่ได้จากราคาออปชั่นที่สังเกตเมื่อเวลา 11:00 น. AEDT วันที่ 2 กุมภาพันธ์ 2026

สิ่งเหล่านี้เป็นการประมาณการโดยนัยของตลาดและอาจเปลี่ยนแปลงการเคลื่อนไหวของราคาหลังรายได้จริงอาจมีขนาดใหญ่หรือเล็กกว่า

สิ่งนี้หมายความว่าอย่างไรสำหรับผู้เข้าร่วมตลาดออสเตรเลีย

รายได้ของ Alphabet อาจมีอิทธิพลต่อความเชื่อมั่นในระยะใกล้ของดัชนีหุ้นหลักของสหรัฐฯ โดยเฉพาะผลิตภัณฑ์ที่เชื่อมโยงกับ NASDAQ โดยมีโอกาสแพร่กระจายไปในเซสชันเอเชียหลังจากการเปิดตัว

หมายเหตุความเสี่ยงที่สำคัญ

ทันทีหลังจากปิดตลาดสหรัฐฯ และเข้าสู่ช่วงต้นของเซสชันเอเชีย ฟิวเจอร์สของ Nasdaq 100 (NDX) และการกำหนดราคา CFD ที่เกี่ยวข้องสามารถสะท้อนสภาพคล่องที่ลดลง สเปรดที่กว้างขึ้น และการปรับราคาที่คมชัดขึ้นตามข้อมูลใหม่

สภาพแวดล้อมดังกล่าวสามารถเพิ่มความเสี่ยงของช่องว่างและความไม่แน่นอนในการดำเนินการเมื่อเทียบกับเงื่อนไขชั่วโมงปกติ

Mike Smith
February 2, 2026
US Earnings
Market insights
Amazon (AMZN): แนวโน้มรายได้ของสหรัฐฯ

วันที่รายได้ที่คาดหวัง: วันพฤหัสบดีที่ 5 กุมภาพันธ์ 2026 (สหรัฐฯหลังจากปิดตลาด) /ต้นวันศุกร์ที่ 6 กุมภาพันธ์ 2026

รายได้ของ Amazon ให้ข้อมูลเชิงลึกเกี่ยวกับแนวโน้มการใช้จ่ายของผู้บริโภคทั่วโลก ความต้องการโครงสร้างพื้นฐานระบบคลาวด์ และการสร้างรายได้จากระบบนิเวศในด้านการค้าปลีก การโฆษณา และบริการสมัครสมาชิก

คาดว่าจะยังคงมุ่งเน้นไปที่ประสิทธิภาพในด้านธุรกิจที่สำคัญ พร้อมกับความคิดเห็นเกี่ยวกับประสิทธิภาพด้านต้นทุน ค่าใช้จ่ายทุน และการลงทุนที่เกี่ยวข้อง AI รวมถึงการขยายศูนย์ข้อมูล

พื้นที่สำคัญที่มุ่งเน้น

ร้านค้าออนไลน์และบริการของบุคคลที่สาม

ธุรกิจค้าปลีกหลักของ Amazon ยังคงไวต่อความต้องการของผู้บริโภคตามดุลยพินิจโดยเฉพาะในช่วงวันหยุดเดือนธันวาคมถึงไตรมาสตลาดมีแนวโน้มที่จะมุ่งเน้นไปที่การเติบโตของรายได้และอัตรากำไรในทั้งบริการค้าปลีกของบุคคลที่หนึ่งและผู้ขายของบุคคลที่สามแรงกดดันต้นทุนจะได้รับการประเมินด้วย

AWS (บริการเว็บของอเมซอน)

AWS เป็นตัวขับเคลื่อนรายได้ที่สำคัญนักลงทุนมีแนวโน้มที่จะมุ่งเน้นไปที่อัตราการเติบโตของรายได้ แนวโน้มมาร์จิ้น และบ่งชี้เกี่ยวกับการใช้จ่ายบนคลาวด์ขององค์กรปริมาณงาน AI จะน่าสังเกตเช่นกันความคิดเห็นใด ๆ เกี่ยวกับการขยายกำลังการผลิตและ capex มีแนวโน้มที่จะถูกเฝ้าระวังอย่างใกล้ชิด

บริการโฆษณา

ธุรกิจโฆษณาของ Amazon กลายเป็นผู้ให้ผลกำไรที่สำคัญมากขึ้นเรื่อย ๆตลาดมีแนวโน้มที่จะประเมินโมเมนตัมการเติบโต ความต้องการของผู้โฆษณา และวิธีที่โฆษณารวมเข้าด้วยกันในระบบนิเวศค้าปลีกและระบบนิเวศของ Prime ของ Amazon

บริการสมัครสมาชิก (รวมถึง Prime)

รายได้จากการสมัครสมาชิกรวมถึงการเป็นสมาชิก Prime และบริการดิจิทัลที่เกี่ยวข้องนักลงทุนอาจดูการมีส่วนร่วม การเปลี่ยนแปลงของราคา และแนวโน้มการกักเก็บรักษาเป็นตัวบ่งชี้ความแข็งแกร่งของระบบ

กรอบต้นทุนและมาร์จิ้น

ก่อนหน้านี้ฝ่ายบริหารได้เน้นถึงความจำเป็นในการมีวินัยด้านต้นทุนในด้านการจัดการ โลจิสติกส์ และค่าใช้จ่ายขององค์กรอัตรากำไรจากการดำเนินงานที่รายงานและการอัปเดตใด ๆ เกี่ยวกับการเพิ่มประสิทธิภาพหรือลำดับความสำคัญในการลงทุนใหม่ในบริการทางธุรกิจที่สำคัญจะเป็นที่น่าสนใจ

เกิดอะไรขึ้นไตรมาสที่แล้ว

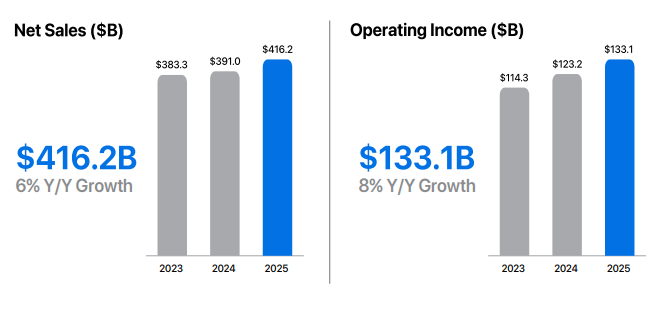
การอัปเดตรายไตรมาสล่าสุดของ Amazon รายงานการเติบโตของรายได้และผลลัพธ์ของรายได้จากการดำเนินงาน โดยอ้างอิงว่า AWS และการโฆษณาเป็นผู้มีส่วนร่วมที่สำคัญ ควบคู่ไปกับมาตรการควบคุมต้นทุนอย่างต่อเนื่องในธุรกิจค้าปลีก

การอัปเดตก่อนหน้านี้ยังรวมถึงการอภิปรายที่เกี่ยวข้องกับลำดับความสำคัญในการลงทุนในโครงสร้างพื้นฐานคลาวด์และ AI ซึ่งยังคงมีอิทธิพลต่อความคาดหวังของตลาด

ไฮไลท์ที่สำคัญของรายได้ล่าสุด

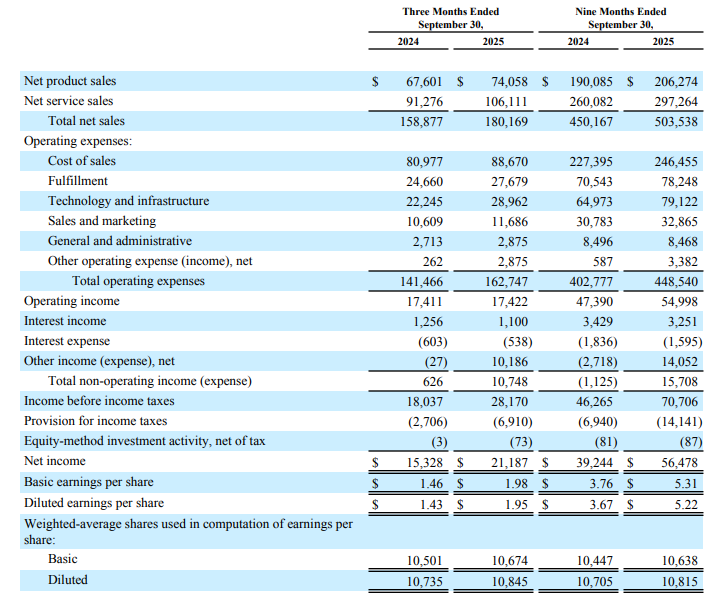
  • รายได้: 180.2 พันล้านเหรียญสหรัฐ
  • กำไรต่อหุ้น (EPS): 1.95 เหรียญสหรัฐ (เจือจาง)
  • รายได้ AWS: 33.0 พันล้านเหรียญสหรัฐ
  • รายได้จากบริการโฆษณา: 17.7 พันล้านเหรียญสหรัฐ
  • รายได้จากการดำเนินงาน: 17.4 พันล้านเหรียญสหรัฐ

ตลาดมีปฏิกิริยาอย่างไรในครั้งล่าสุด

หุ้น Amazon ปรับตัวสูงขึ้นในการซื้อขายหลังชั่วโมงหลังการเปิดตัวครั้งก่อน ตามการรายงานในขณะนั้น

งบการดำเนินงานรวมของ Amazon ไตรมาสที่ 3 ปี 2555

สิ่งที่คาดหวังในไตรมาสนี้

การประมาณการที่เห็นด้วยกันของ Bloomberg ชี้ให้เห็นถึงการเติบโตของ EPS ต่อปีสำหรับไตรมาสสิ้นเดือนธันวาคม 2025 โดยตลาดมุ่งเน้นไปที่ผลลัพธ์รายได้ อัตรากำไรจากการดำเนินงาน และประสิทธิภาพ AWS เนื่องจากความสำคัญของไตรมาสธันวาคม (ไตรมาสที่ 4) ต่อโปรไฟล์รายได้ของ Amazon

จุดอ้างอิงฉันทามติของ Bloomberg (มกราคม 2026):

  • อีพีเอส: ประมาณ เหรียญสหรัฐ$1.60
  • รายได้: ประมาณ 170 พันล้านเหรียญสหรัฐ
  • EPS ประจำปี FY2026: ประมาณ 5.10 เหรียญสหรัฐ

*ประเด็นข้างต้นทั้งหมดสังเกตเมื่อวันที่ 27 มกราคม 2026

ความคาดหวัง

ความเชื่อมั่นของตลาดรอบๆ Amazon อาจมีความอ่อนไหวต่อความผิดหวังในการเติบโตของ AWS อัตรากำไรจากการดำเนินงาน หรือประสิทธิภาพการค้าปลีกไตรมาสเดือนธันวาคม (ไตรมาสที่ 4 2025) เนื่องจากมีน้ำหนักดัชนีขนาดใหญ่ของหุ้นภายในดัชนีหุ้นหลักของสหรัฐฯ และบทบาทในพื้นที่เหล่านี้

ตัวเลือกที่จดทะเบียนมีการกำหนดราคาการเคลื่อนไหวที่บ่งชี้ประมาณ ± 4% ถึง ± 5% โดยอิงจากการประมาณการการเคลื่อนไหวโดยนัยที่คาดว่าจะมีการเคลื่อนไหวโดยนัยที่คาดว่าจะเกิดขึ้นใน Barchart เวลา 11:00 น. AEDT 28 มกราคม 2026

ความผันผวนโดยนัยอยู่ที่ประมาณ 32% ต่อปีในเวลานั้น

นี่คือการประมาณการโดยนัยตามตลาด (ไม่ใช่การคาดการณ์) และอาจเปลี่ยนแปลงการเคลื่อนไหวของราคาหลังรายได้จริงอาจมีขนาดใหญ่หรือเล็กกว่า

สิ่งนี้หมายความว่าอย่างไรสำหรับนักลงทุนชาวออสเตรเลีย

รายได้ของ Amazon อาจมีอิทธิพลต่อความเชื่อมั่นในระยะใกล้ในดัชนีหุ้นหลักของสหรัฐฯ โดยอาจมีการแพร่กระจายไปในเซสชันเอเชียหลังจากการเปิดตัวนอกจากนี้ยังอาจมีอิทธิพลต่อความเชื่อมั่นต่อบริษัทจดทะเบียน ASX ที่มีโอกาสในการขายออนไลน์อย่างมีนัยสำคัญ

หมายเหตุความเสี่ยงที่สำคัญ

ทันทีหลังจากปิดตลาดสหรัฐฯ และเข้าสู่ช่วงต้นของเซสชันเอเชีย ฟิวเจอร์สของ Nasdaq 100 (NDX) และการกำหนดราคา CFD ที่เกี่ยวข้องสามารถสะท้อนสภาพคล่องที่ลดลง สเปรดที่กว้างขึ้น และการปรับราคาที่คมชัดขึ้นตามข้อมูลใหม่

สภาพแวดล้อมดังกล่าวสามารถเพิ่มความเสี่ยงของช่องว่างและความไม่แน่นอนในการดำเนินการเมื่อเทียบกับเงื่อนไขชั่วโมงปกติ

Mike Smith
January 30, 2026
US Earnings
Market insights
Apple Inc. (AAPL): US earnings outlook

Expected earnings date: Thursday, 29 January 2026 (US, after market close) / early Friday, 30 January 2026 (AEDT)

Key areas in focus

iPhone

The iPhone remains Apple’s largest revenue driver. Markets are likely to focus on unit demand, product mix (including higher-end models), and any signals on upgrade momentum and regional trends.

Services

Investors are likely to focus on growth across areas such as the App Store, iCloud, Apple Music and other subscriptions, alongside any commentary on average revenue per user (ARPU). The size and engagement of Apple’s installed base remain central to overall performance.

Wearables, home and accessories

This segment includes products such as Apple Watch, AirPods, Beats headphones, home-related devices, and accessories. Investors are likely to watch revenue trends in this segment as an indicator of discretionary consumer demand. 

Cost and margin framework

Management has flagged tariff and component cost pressures in prior commentary. Markets may remain sensitive to gross margin commentary and any signals of incremental cost pressure or mitigation strategies. 

What happened last quarter

Apple’s most recent quarterly update (fiscal Q4 2025) highlighted record September-quarter revenue and EPS, alongside record Services revenue and continued emphasis on installed-base strength.  

The prior update also included discussion of holiday-quarter expectations and cost headwinds (including tariffs), which have influenced expected margins and management guidance.

Last earnings key highlights

  • Revenue: US$102.5 billion 
  • Earnings per share (EPS): US$1.85 (diluted) 
  • iPhone revenue: US$49.03 billion 
  • Services revenue: US$28.75 billion 
  • Net income: US$27.5 billion 

How the market reacted last time

Apple shares rose in after-hours trading following the release, as investors assessed the results against analyst expectations and management’s holiday-quarter commentary, including tariff-related cost pressures and regional demand considerations. 

Apple 2025 business highlights

What’s expected this quarter

Bloomberg consensus points to year-on-year EPS growth, with markets also focused on the revenue outcome and gross margins, given the scale and importance of the holiday quarter for Apple’s earnings profile. 

Bloomberg consensus reference points (January 2026):

  • EPS: about US$2.65 
  • Revenue: about US$138 billion 
  • Full-year FY2026 EPS: about US$8.1 

*All above points observed as of 26 January 2026.

Expectations

Sentiment around Apple may be sensitive to any disappointment on holiday-quarter revenue, Services momentum, or margin commentary, given the stock’s large index weight and the importance of this reporting period. 

Listed options were implying an indicative move of around ±3% to ±4% based on near-dated, at-the-money options-implied expected move estimates observed on Barchart at 11:00 am AEDT on 25 January 2026.  Implied volatility was approximately 29% annualised at that time. 

These are market-implied estimates (not a forecast) and may change. Actual post-earnings price moves can be larger or smaller.

What this means for Australian traders

Apple’s earnings can influence near-term sentiment across major US equity indices, particularly Nasdaq-linked products, with potential spillover into the Asia session following the release.

Important risk note 

Immediately after the US close and into the early Asia session, Nasdaq 100 (NDX) futures and related CFD pricing can reflect thinner liquidity, wider spreads, and sharper repricing around new information. 

Such an environment can increase gap risk and execution uncertainty relative to regular-hours conditions.

Mike Smith
January 28, 2026