Perspectivas mundiales de divisas para febrero: USD, EUR, JPY y AUD
Mike Smith
6/2/2026
•
0 min read
Share this post
Copy URL
Es probable que el panorama de divisas de febrero se vea impulsado por la persistencia de la inflación, la resiliencia laboral y las comunicaciones de los bancos centrales. Con varias publicaciones de datos de alto impacto en los EE. UU., Europa, Japón y Australia, los movimientos a corto plazo pueden estar más impulsados por eventos y basados en represalias, en lugar de estar dirigidos por tendencias.
Datos rápidos
El USD sigue siendo el punto de referencia clave, ya que los datos estadounidenses impulsan la refijación de precios en los rendimientos y el mercado de divisas en general.
La sensibilidad del EUR sigue siendo alta en torno a los mensajes del Banco Central Europeo (BCE) y las señales entrantes de inflación y actividad.
El JPY sigue estrechamente vinculado a los datos nacionales y a la comunicación del Banco de Japón (BOJ), y el USD/JPY a menudo reaccionan bruscamente a los cambios en las expectativas de rendimiento.
El AUD sigue siendo sensible a las políticas, con la inflación interna y los datos laborales probablemente más importantes, junto con el tono de riesgo global y los metales.
Dólar estadounidense (USD)
Eventos clave
Nóminas no agrícolas (NFP) y desempleo: 8:30 a.m., 11 febrero (ET) | 12:30 a.m., 12 febrero (AEDT)
Índice de Precios al Consumidor (IPC), título y núcleo: 8:30 a.m., 13 febrero (ET) | 12:30, 13 de febrero (AEDT)
Ingresos y desembolsos personales (incluye el índice de precios PCE): 8:30, 20 de febrero (ET) | 12:30, 21 de febrero (AEDT)
Qué ver
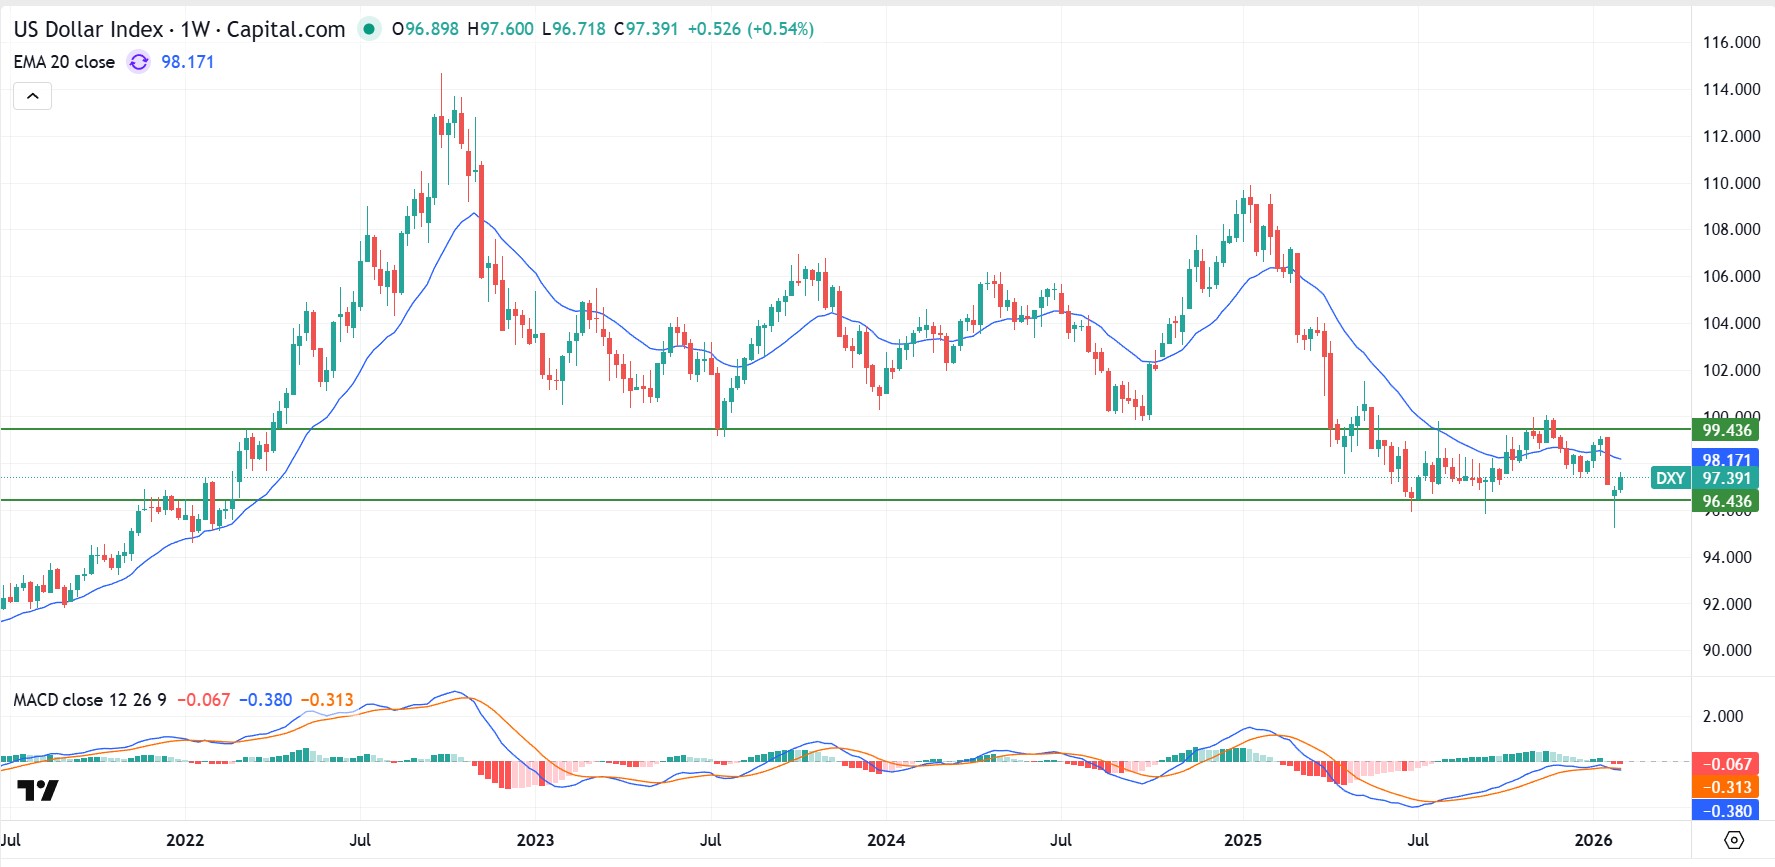
Es probable que el USD siga siendo impulsado principalmente por los cambios en los datos de inflación y mano de obra y sus implicaciones para las expectativas de tasas de la Reserva Federal. Titulares recientes que rodean Independencia de la Reserva Federal también han agregado volatilidad al posicionamiento del USD.
Una mayor inflación o resiliencia laboral a menudo se asocia con un soporte más firme del USD a través de expectativas de rendimiento más altas. Los resultados más suaves podrían reducir el soporte de las tasas y permitir que pares como EUR/USD y AUD/USD se estabilice.
Gráfico clave: Gráfico semanal del índice del dólar estadounidense (DXY)
Decisión de política del BCE: 12:15 a.m., 6 de febrero (AEDT)
Conferencia de prensa del BCE: 12:45 a.m., 6 de febrero (AEDT)
Estimaciones flash del BCE para el PIB y el empleo: 20:00 horas, 13 de febrero (AEDT)
Qué ver
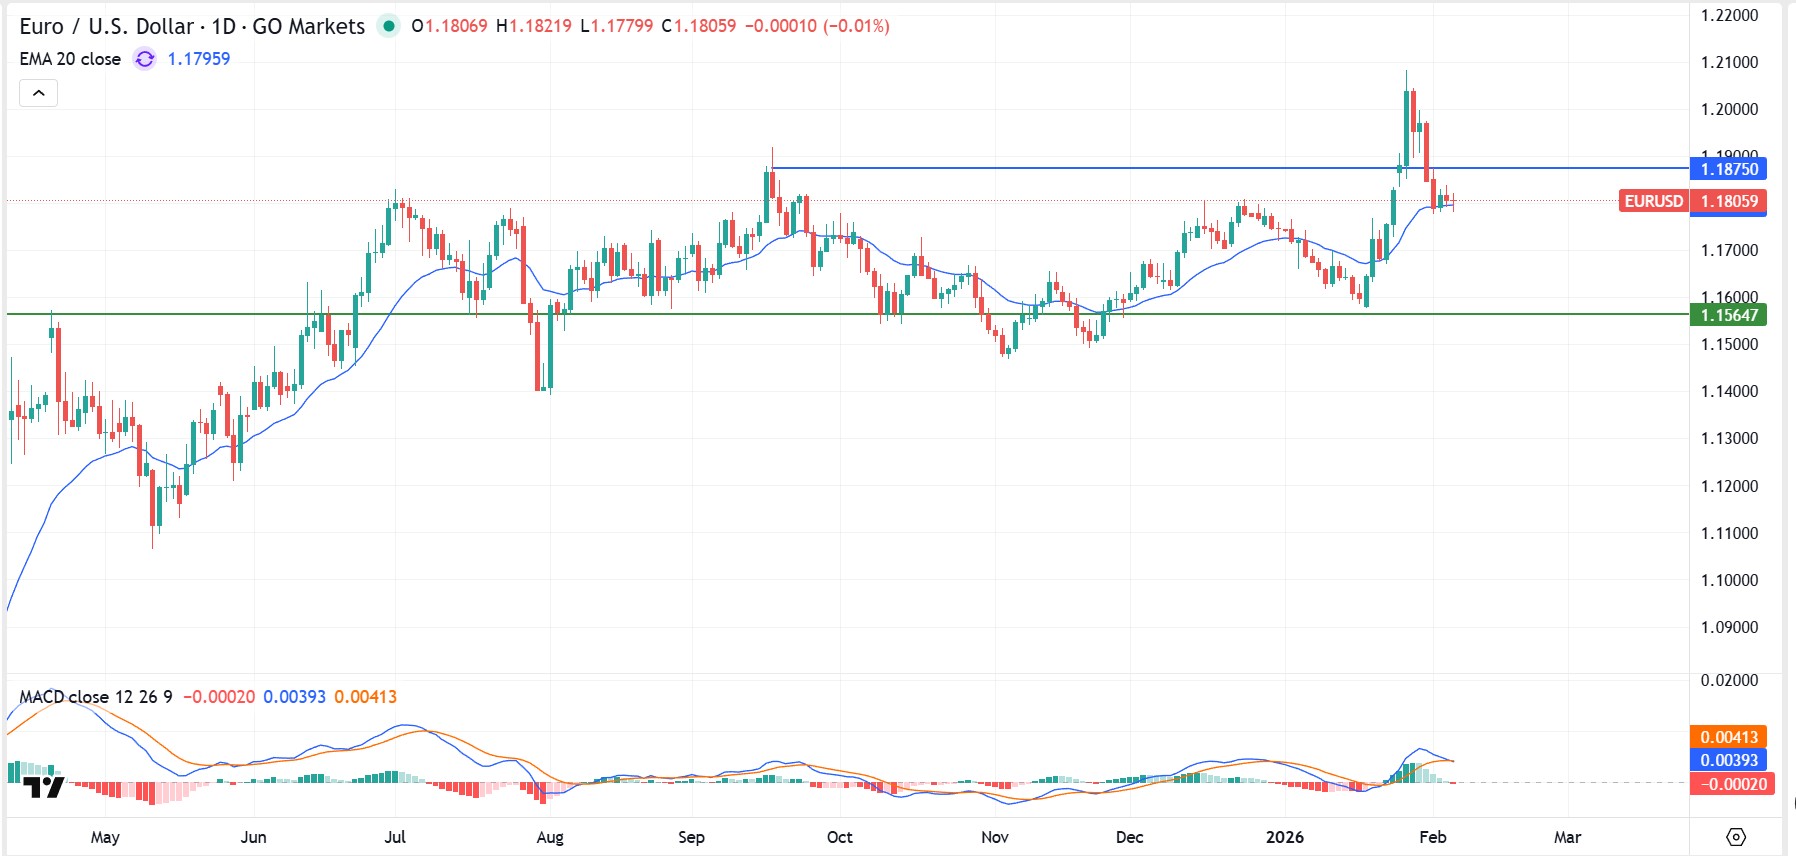
EUR la dirección sigue ligada a si el BCE puede mantener su postura sin un deterioro material de la actividad, o si los datos de inflación y crecimiento impulsan hacia adelante flexibilizan las expectativas.
El crecimiento resiliente y la inflación firme podrían respaldar el sesgo de precios “más alto por más tiempo”. Un crecimiento más débil o una inflación más suave podrían pesar sobre la moneda, particularmente si adelantan expectativas de flexibilización.
PIB preliminar de Japón (cuarto trimestre de 2025, primer preliminar): 18:50 p.m., 15 de febrero (ET) | 10:50 a.m., 16 de febrero (AEDT)
IPC nacional (Japón): 20 de febrero (Japón)
Qué ver
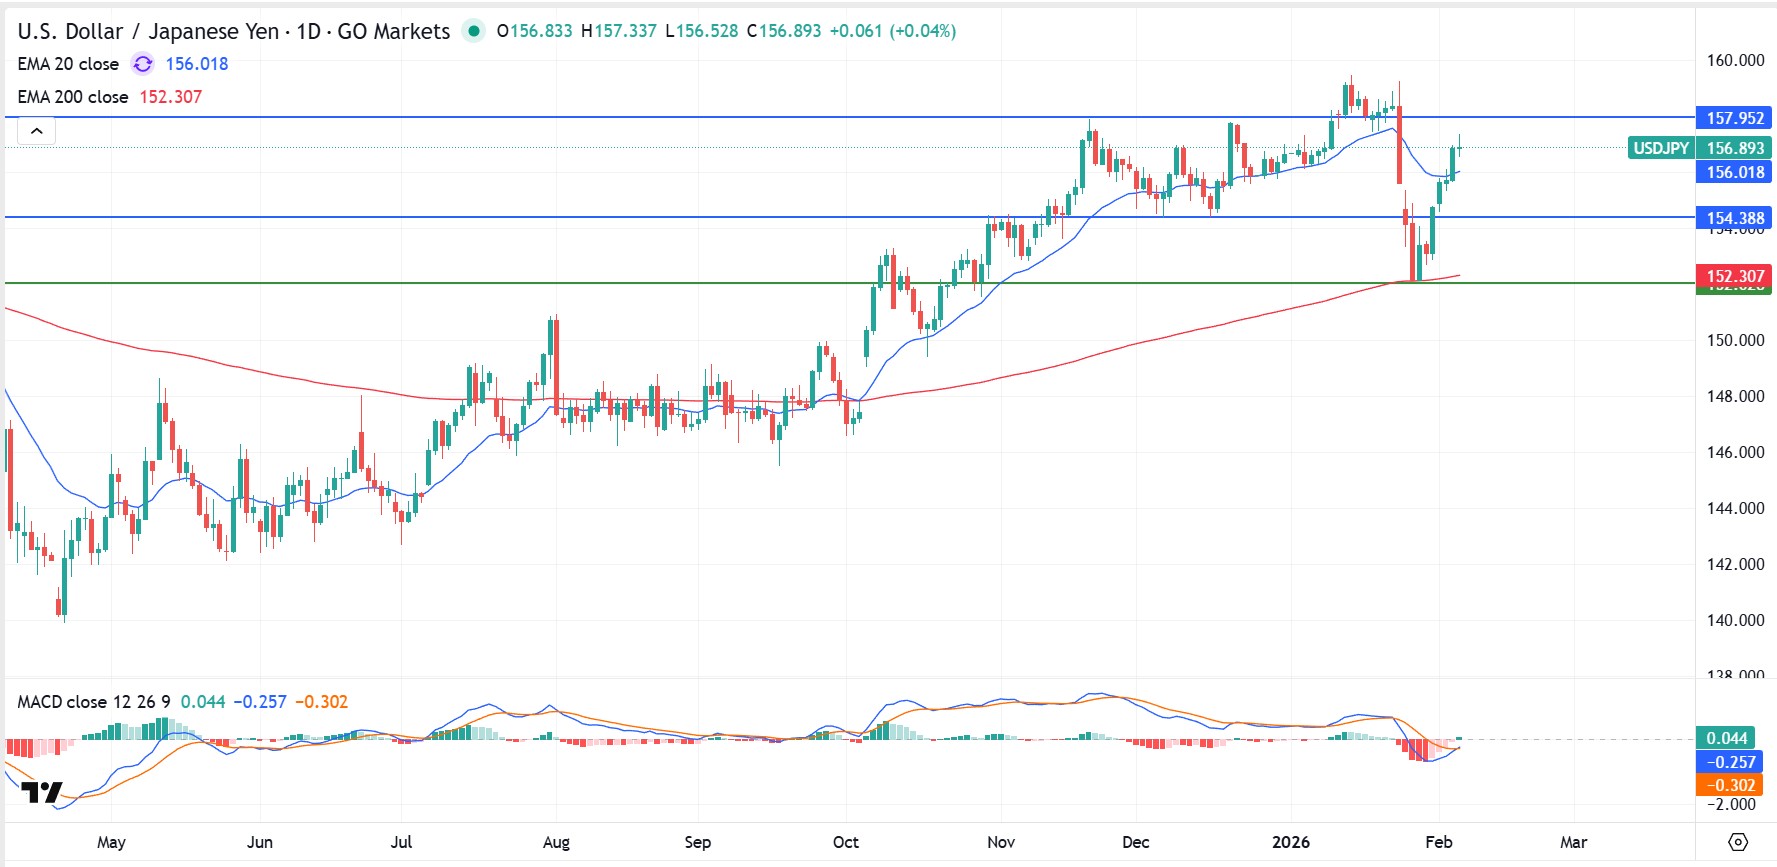
El JPY sigue siendo sensible a los cambios de rendimiento interno y a la comunicación del BOJ. Incluso ajustes modestos a las expectativas de las políticas podrían generar movimientos desmedidos en el USD/JPY.
El crecimiento firme o los resultados de inflación podrían apoyar al JPY a través de rendimientos internos más altos y expectativas cambiantes del BOJ. Los resultados más suaves o los mensajes de política cautelosos podrían mantener el soporte del USD/JPY.
Índice de precios salariales: 11:30 a.m., 18 de febrero (AEDT)
Encuesta sobre la fuerza de trabajo: 11:30 h, 19 febrero (AEDT)
Índice de Precios al Consumidor (IPC): 11:30 a.m., 25 de febrero (AEDT)
Qué ver
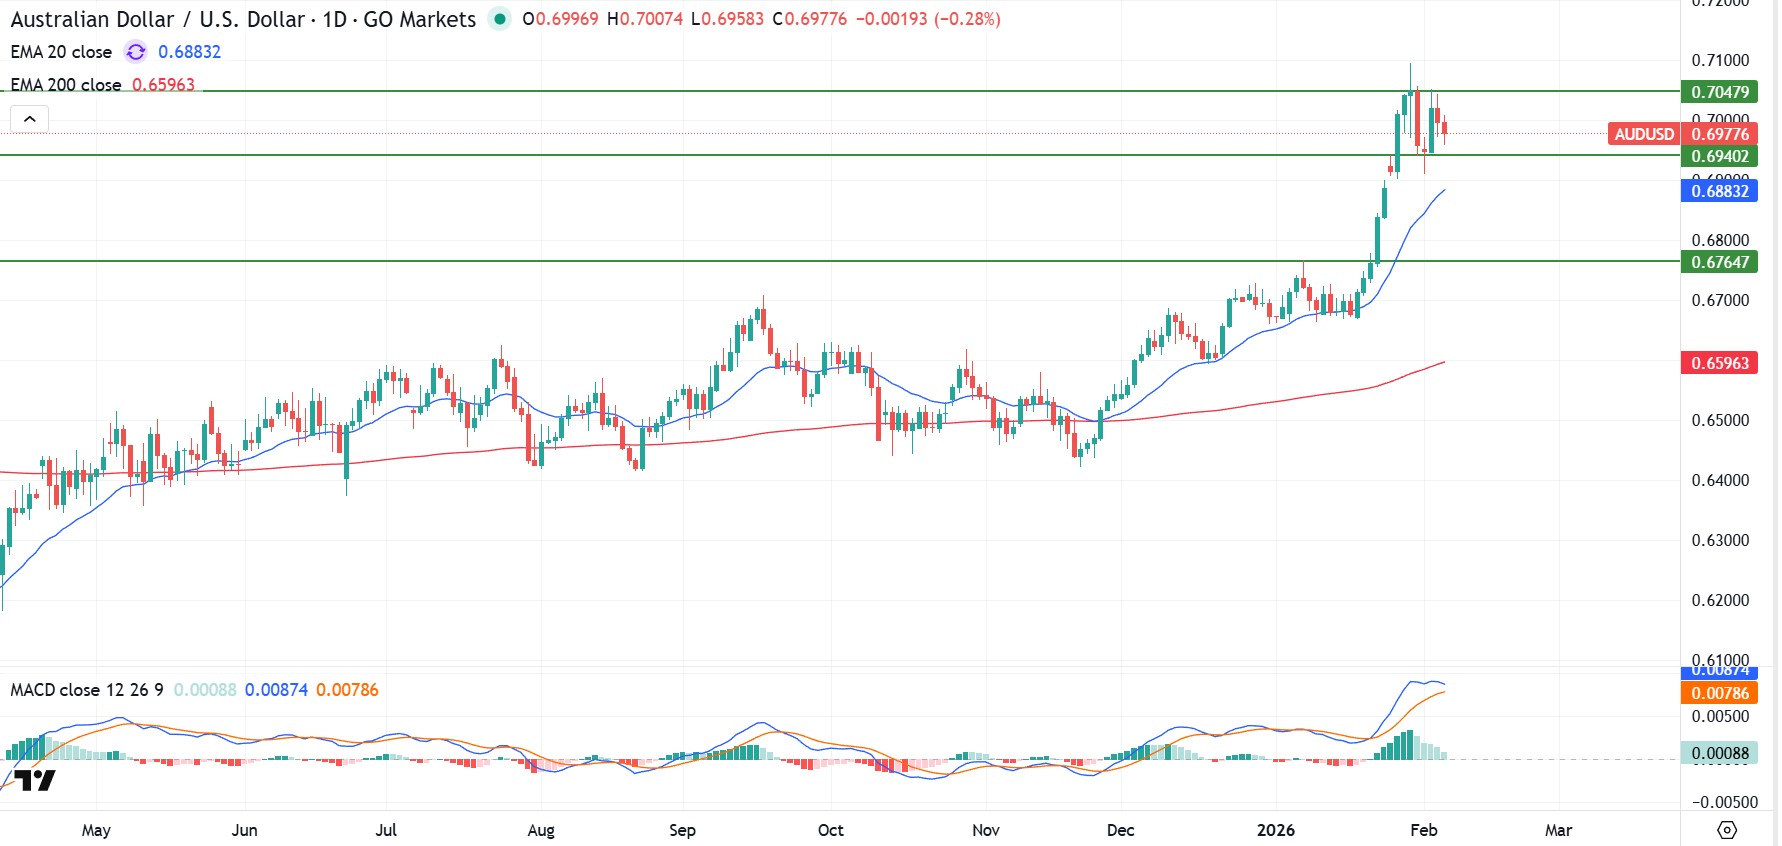
El AUD sigue siendo sensible a las políticas, respondiendo rápidamente a la inflación interna y a los datos laborales, así como al sentimiento de riesgo global y su impacto en los precios de los metales.
Los salarios persistentes o las presiones inflacionarias podrían apoyar al AUD a través de expectativas políticas más firmes. El ablandamiento de los datos podría reducir el soporte de las tasas y afectar el desempeño del AUD, particularmente en comparación con el USD y el JPY.
Mike Smith (MSc, PGdipEd)
Client Education and Training
The information provided is of general nature only and does not take into account your personal objectives, financial situations or needs. Before acting on any information provided, you should consider whether the information is suitable for you and your personal circumstances and if necessary, seek appropriate professional advice. All opinions, conclusions, forecasts or recommendations are reasonably held at the time of compilation but are subject to change without notice. Past performance is not an indication of future performance. Go Markets Pty Ltd, ABN 85 081 864 039, AFSL 254963 is a CFD issuer, and trading carries significant risks and is not suitable for everyone. You do not own or have any interest in the rights to the underlying assets. You should consider the appropriateness by reviewing our TMD, FSG, PDS and other CFD legal documents to ensure you understand the risks before you invest in CFDs.
Comience con lo que realmente sucedió con los mercados de divisas en el período previo a abril: hubo un choque geopolítico y el suministro de petróleo fuera de Medio Oriente estuvo bajo presión. La reacción inmediata en los mercados de divisas fue la que los comerciantes han visto antes: el dinero se movió hacia la seguridad, hacia el rendimiento y lejos de cualquier cosa que pareciera expuesta a la interrupción.
Los flujos de refugio seguro satisfacen la divergencia de rendimiento
El dólar estadounidense se benefició de ambas fuerzas a la vez. Es un refugio seguro y también lleva una ventaja de rendimiento que la mayoría de sus pares no puede igualar en este momento. El franco suizo recogió parte del desbordamiento de la aversión al riesgo europea. El yen, que solía atraer flujos de refugio seguro casi automáticamente, está atascado en una situación completamente diferente donde la brecha de rendimiento frente al dólar es ahora tan amplia que la lógica de refugio seguro ha sido anulada por la lógica de acarreo.
Las monedas que tuvieron el mes más duro fueron las atrapadas en el medio: sensibles al riesgo, vinculadas a las materias primas o ejecutando tasas de política que simplemente no pueden competir. El dólar neozelandés es el ejemplo más claro mientras que el dólar australiano es una historia más descompuesta. Debajo de todo esto hay una revaluación de las expectativas de recorte de tasas de 2026 que los bancos centrales de múltiples países ahora están reevaluando.
DXY context
Regained 100 on geopolitical risk
Strongest currency
USD — safe haven plus yield
Weakest currency
NZD — yield gap plus energy
Main central bank theme
Repricing of 2026 rate cut paths
Main catalyst ahead
Fed and BOJ policy meetings
Monthly leaderboard — biggest movers
01USD
Rose sharply on safe-haven demand and higher for longer yield expectations.
Strong
02CHF
Advanced strongly as the preferred European refuge from Middle East risk.
Up
03JPY
Highly volatile; fell to 20-month lows before intervention commentary.
Volatile
04AUD
Mixed; caught between domestic energy inflation and a hawkish RBA.
Mixed
05NZD
Fell sharply; pressured by energy exposure and capital outflows.
Weak
El más fuerte en mover: US dollar (USD)
El dólar estadounidense gastó la mayor parte de 2025 perdiendo terreno gradualmente a medida que la Fed recortaba las tasas y el resto del mundo jugaba a ponerse al día. Esa historia se estancó duramente a finales de marzo. El conflicto de Irán cambió el cálculo, y el dólar se reafirmar de una manera que refleja algo real sobre su posición estructural en los mercados globales.
Estados Unidos exporta petróleo y cuando los precios de la energía suben, eso es una mejora en términos de intercambio, no un shock en términos de intercambio. La mayoría de los principales pares del dólar se sientan del otro lado de esa ecuación. Agregue un rango de tasa de póliza de 3.50% a 3.75% que ahora parece bloqueado por más tiempo, y la ventaja del dólar es cíclica y estructural al mismo tiempo. El índice del dólar estadounidense (DXY) ha recuperado el nivel 100 pero la pregunta de cara a abril es si se mantiene ahí o empuja más.
Key drivers
Safe-haven demand:
The Iran conflict directed flows into US assets across equities, Treasuries, and the dollar itself.
Yield advantage:
The federal funds rate at 3.50% to 3.75% provides a meaningful return floor relative to most peers, helping to sustain capital inflows.
Energy insulation:
The US position as an oil exporter creates a structural terms-of-trade benefit when oil prices rise sharply.
Rate cut repricing:
Market expectations for 2026 Fed cuts have been scaled back significantly, removing a key source of dollar headwinds.
What markets are watching next
The DXY's ability to hold above 100 is the near-term reference point. The 10 April CPI print is the most direct test. A reading above expectations may add further support, while a soft print could give traders reason to take some dollar positions off the table.
The main risks to the upside case are a sudden diplomatic resolution in the Middle East, which could reduce safe-haven demand quickly, or a labour market print on 3 April that is weak enough to revive recession concerns and push rate cut expectations higher again.
Lugar de mudanza más débil: Dolar de Nueva Zelanda (NZD)
Si quisieras diseñar una moneda que luchen en el entorno actual, el NZD encaja casi perfectamente al brief. Es sensible al riesgo. Está ligado a la mercancía. Ejecuta una tasa de política de 2.25%, que se sitúa por debajo de la Fed y ahora también por debajo del RBA. Nueva Zelanda también es un importador de energía, por lo que el aumento de los precios del petróleo golpeó la balanza comercial y la perspectiva de inflación interna al mismo tiempo.
Ninguna de esas cosas es nueva pero la combinación de todas ellas golpeando a la vez, en un contexto de alza del dólar y amplio sentimiento de riesgo, ha comprimido el NZD de una manera que es difícil de ignorar. El carry trade que alguna vez hizo atractivo al NZD se ha revertido ya que el capital se ha ido moviendo hacia afuera, no hacia dentro.
Key drivers
Energy import exposure:
Rising Brent crude hits New Zealand's trade balance directly and adds upside pressure to domestic inflation.
Yield gap:
The 2.25% Reserve Bank of New Zealand (RBNZ) policy rate sits below the Fed and the RBA, sustaining negative carry against both the USD and AUD.
Risk-off positioning:
As a commodity and risk currency, the NZD tends to underperform when global sentiment deteriorates.
Trade uncertainty:
Ongoing tariff related uncertainty continues to weigh on export sector confidence.
Risks and constraints
Any unexpected hawkish commentary from the RBNZ or a sharp decline in oil prices could provide some relief. A broader improvement in global risk appetite would also tend to benefit the NZD, given its sensitivity to sentiment shifts.
But the structural yield disadvantage is not going away quickly, and that may continue to limit the pair's recovery potential.
USD/JPY
USD/JPY es el par que ilustra más claramente lo que sucede cuando el estatus de refugio seguro de una moneda es anulado por la lógica de acarreo. El yen solía ser el primer puerto de llamada para los comerciantes que buscaban protección durante el estrés geopolítico. Esa dinámica ha sido suprimida, y la razón es sencilla: renuncias a demasiado rendimiento para mantener el yen en este momento.
El tipo de interés de política del Banco de Japón (BOJ) se sitúa en 0.75% mientras que el de la Fed se ubica en 3.50% a 3.75% y esa brecha no fomenta los flujos de refugio seguro. Alienta el endeudamiento en yenes y el despliegue en otros lugares. Entonces, mientras el dólar subió por riesgo geopolítico, el yen cayó en el mismo evento. No es así como se supone que funcione, pero es como funcionan las matemáticas cuando los diferenciales de rendimiento son tan amplios.
El USD/JPY se ubica cerca de 159, lo que lo deja no muy lejos del nivel 160 que el Ministerio de Finanzas de Japón ha señalado consistentemente como una línea que requiere atención. La reunión del BOJ del 27 y 28 de abril es ahora un evento genuinamente en vivo.
Key events to watch
Tokyo CPI, 30 March (AEDT):
March inflation data. A strong read may build the case for BOJ action at the April meeting.
BOJ meeting, 27 and 28 April (AEST):
Markets are treating this as a live event. The quarterly outlook report may include updated inflation forecasts that shift rate hike timing expectations.
Intervention watch:
Japan's Ministry of Finance has been explicit about the 160 level. Actual intervention, or a credible threat of it, could trigger a sharp and fast reversal.
What could shift the outlook
A hawkish BOJ, actual FX intervention, or a softer US CPI print that reduces dollar support could all push USD/JPY lower from current levels. On the other side, a dovish hold from the BOJ combined with continued dollar strength could see the pair test 160 and potentially beyond, which would likely intensify the intervention conversation in Tokyo.
For traders watching AUD/JPY and other yen crosses, the BOJ meeting on 27 and 28 April carries similar weight. A hawkish shift tends to compress yen crosses broadly, not just USD/JPY.
Datos para ver a continuación
Cuatro eventos se destacan como los catalizadores potenciales de FX más claros en las próximas semanas. Cada uno tiene un canal de transmisión directo hacia las expectativas de tasa, y las expectativas de tasa están impulsando gran parte del movimiento en FX en este momento.
Key dates and FX sensitivity
30
Mar
Tokyo CPI
JPY pairs, USD/JPY · AEDT
A strong read may strengthen the case for a more hawkish BOJ at the April meeting.
3
Apr
US labour market (NFP)
USD pairs, AUD/USD, NZD/USD · 10:30 pm AEDT
A weak result could revive recession concerns and alter Fed pricing.
10
Apr
US CPI - March
USD/JPY, EUR/USD, gold · 10:30 pm AEST
The most direct test of whether inflation is easing fast enough to reopen the rate cut conversation.
27-28
Apr
BOJ meeting and quarterly outlook report
JPY crosses, AUD/JPY · AEST
The key policy event for yen crosses. Updated inflation forecasts may shift rate hike timing expectations.
Niveles y señales clave
Estos son los puntos de referencia que los comerciantes y los formuladores de políticas están observando más de cerca. Cada uno representa un detonante potencial para un cambio en el posicionamiento o una respuesta oficial.
◆
DXY 100.00
A psychologically and technically significant support level. Holding above it may sustain the dollar's current run across major pairs. A break below it would likely signal a broader sentiment shift.
◆
USD/JPY 160.00
Japan's Ministry of Finance has consistently referenced this level as a threshold requiring attention. Actual intervention, or a credible threat of it, has historically been capable of producing sharp and fast reversals in the pair.
◆
Brent crude US$120
A move to this level would likely intensify risk off behaviour across FX markets, putting further pressure on energy importing currencies including the NZD, EUR, and JPY.
◆
AUD/USD 0.7000
This level has historically attracted buying interest and may act as a near term directional reference for positioning in the pair.
Bottom line
The FX moves heading into April were shaped by a combination of geopolitical shock, yield divergence, and a repricing of central bank expectations that few had positioned for at the start of the quarter. The dollar's dual role as a high yielding and safe haven currency has put it in an unusually strong position, but that position is not unconditional.
One soft CPI print, one diplomatic breakthrough, or one labour market miss could change the tone quickly. Currency moves may remain highly data dependent and sensitive to overnight news flow from the Middle East, where developments can gap markets before the next session opens.
Acceda a un universo FX más amplio y manténgase flexible a medida que cambian las condiciones. Abrir una cuenta · Iniciar sesión
Aquí está la situación como comienza abril. Una guerra está afectando uno de los puntos de choque petroleros más importantes del mundo. El crudo Brent cotiza por encima de los 100 dólares estadounidenses. Y la Reserva Federal (Fed), que pasó gran parte de 2025 ingeniando un aterrizaje suave, ahora enfrenta una amenaza inflacionaria impulsada menos por los salarios, los servicios o la economía doméstica, y más por la energía. Está viendo un choque petrolero.
El tipo de los fondos de la Fed se sitúa en 3.50% a 3.75%. La próxima reunión del Comité Federal de Mercado Abierto (FOMC) es el 28 y 29 de abril y la pregunta clave para los mercados no es si la Fed recortará, es si la Fed puede recortar, o si el choque energético puede haber cerrado esa puerta durante gran parte de 2026.
Una gran cantidad de publicaciones de datos importantes aterriza en abril. El índice de precios al consumidor (IPC) de marzo, las nóminas no agrícolas (PNB) y la estimación anticipada del producto interno bruto (PIB) del primer trimestre son los tres que más importan. Pero el comunicado del FOMC del 29 de abril puede ser el lanzamiento que marque la pauta para el resto del año.
Fed Funds Rate
3.50%–3.75%
Next FOMC
28–29 April 2026
Brent crude
Above US$100
Key data events
12 major releases
Crecimiento: Actividad y demanda del negocio
Piense en cómo se veía la economía estadounidense al entrar este año: el gasto de capital impulsado por la IA (capex) fue una parte importante de la narrativa de crecimiento, las intenciones de inversión corporativa se veían firmes y la Ley One, Big, Beautiful Bill Act ya estaba en la mezcla. Sobre el papel, la historia de crecimiento parecía sólida.
Entonces la situación del Estrecho de Ormuz cambió el cálculo. No porque Estados Unidos sea un importador neto de energía, no lo es, y ese aislamiento estructural importa. Pero lo que es bueno para los productores de energía estadounidenses aún puede exprimir los márgenes en otros lugares y pesar sobre la demanda mundial. Ahora es probable que el avance del 30 de abril la estimación del producto interno bruto (PIB) del primer trimestre se lea a través de dos lentes: qué tan fuerte era la economía antes del shock, y qué podría indicar sobre los trimestres que se avecinan.
Key dates (AEST)
2
Apr
US international trade in goods and services (February)
Bureau of Economic Analysis · 10:30 pm AEDT
Medium
30
Apr
Q1 GDP — advance estimate
Bureau of Economic Analysis · 10:30 pm AEST
High
What markets look for
Resilience in Q1 GDP despite the elevated interest rate environment and early energy cost pressures
Trade balance movements linked to shifting global tariff frameworks
Business investment intentions following passage of the "One Big Beautiful Bill Act"
Early signs of capacity constraints emerging in technology-heavy sectors
How this data may move markets
Scenario
Treasuries
USD
Equities
Stronger than expected growth
↑ Yields rise
↑ Firmer
Mixed - depends on inflation read
Softer growth/GDP miss
↓ Yields fall
↓ Softer
Risk off if stagflation narrative builds
Laborista: Nóminas y empleo
El reporte de empleos de febrero fue, dependiendo de cómo lo leas, ya sea un blip o una señal de advertencia. Las nóminas no agrícolas (NFP) bajaron 92 mil, el desempleo subió a 4.4% y la línea oficial fue que el clima jugó un papel. Eso puede ser cierto pero esto es lo que también sucedió. El mercado laboral de repente se veía un poco menos convincente como el principal argumento para mantener las tasas elevadas.
El informe de empleo del 3 de abril para marzo es ahora genuinamente consecuente. Un rebote al crecimiento positivo de la nómina probablemente estabilizaría los nervios y una segunda letra blanda consecutiva, particularmente en un contexto de mayores precios de la energía, comenzaría a construir una narrativa muy incómoda para la Fed. Estaría viendo un crecimiento más lento del empleo y una amenaza de inflación al mismo tiempo. Ese no es un lugar cómodo para estar.
Key dates (AEST)
3
Apr
March employment situation (NFP and unemployment rate)
Bureau of Labor Statistics · 10:30 pm AEDT
High
30
Apr
Q1 employment cost index
Bureau of Labor Statistics · 10:30 pm AEST
Medium
What markets look for
A return to positive payroll growth, or confirmation that February's softness was the start of a trend
Stabilisation or further movement in the unemployment rate from 4.4%
Average hourly earnings growth relative to core inflation — the wage-price dynamic the Fed watches closely
Weekly initial jobless claims as a real-time signal of whether layoff activity is rising
Inflación: IPC, IPP y PCE
Aquí está la incómoda verdad sobre dónde se encuentra la inflación en este momento. Los gastos básicos de consumo personal (PCE), el indicador preferido de la Fed, ya se ubicaban en 3.1% interanual en enero, antes de que se hubiera alimentado cualquier shock petrolero. La Fed no había resuelto completamente su problema de inflación, más bien, lo había desacelerado. Eso es otra cosa.
Y ahora, además de un problema de inflación no del todo resuelto, los precios del petróleo se han movido bruscamente al alza. Los precios de la energía pueden alimentar el índice de precios al consumidor (IPC) con relativa rapidez, a través de costos de gasolina, transporte y logística que eventualmente pueden aparecer en el precio de casi todo. El impresión del IPC del 10 de abril para marzo es probablemente el lanzamiento de datos individuales más importante del mes, es el que nos puede decir si el choque energético ya está apareciendo en los números que observa la Fed.
Key dates (AEST)
10
Apr
Consumer price index (CPI) — March
Bureau of Labor Statistics · 10:30 pm AEST
High
14
Apr
Producer price index (PPI) — March
Bureau of Labor Statistics · 10:30 pm AEST
Medium
30
Apr
Personal income and outlays incl. PCE price index — March
Bureau of Economic Analysis · 10:30 pm AEST
High
What markets look for
Monthly CPI acceleration driven by energy and shelter components — the two stickiest inputs
PPI as a forward-looking signal: producer cost pressure tends to feed into consumer prices with a lag
PCE trends relative to the Fed's 2% target, particularly the core reading that strips out food and energy
Any sign that AI-related pricing power is feeding into corporate margins in ways that sustain elevated core readings
How this data may move markets
Scenario
Treasuries
USD
Gold
Cooling core inflation
↓ Yields fall
↓ Softer
↑ Supportive
Sticky or rising inflation
↑ Yields rise
↑ Firmer
↓ Headwind
Política, comercio y ganancias
Abril es también el inicio de la temporada de ganancias de Estados Unidos, y los resultados de este trimestre tienen una cantidad inusual de peso. Los inversores han estado vertiendo capital en la infraestructura de IA sobre la base de que se avecinan retornos. La pregunta es cuándo. Con la volatilidad geopolítica impulsando una rotación alejada de la tecnología orientada al crecimiento y hacia la energía y la defensa, las ganancias de JPMorgan Chase del 14 de abril se leerán tanto por lo que la gerencia dice sobre el entorno macro como por los propios números.
Después está la reunión del FOMC los días 28 y 29 de abril. Después de la racha de datos de principios de abril, incluyendo PNB, IPC e índice de precios al productor (PPI), la Fed tendrá información más que suficiente para actualizar su lenguaje. Si señala que los recortes de tasas podrían permanecer en suspenso hasta 2026, o si deja la puerta ligeramente entreabierta, puede ser la comunicación más consecuente del trimestre.
La volatilidad geopolítica ya ha empujado a los inversores a reevaluar el posicionamiento de alto crecimiento. La construcción estimada de 650.000 millones de dólares de la infraestructura de IA también está siendo objeto de un escrutinio más intenso en cuanto al retorno de la inversión. Si la temporada de ganancias decepciona en ese frente, y si el FOMC señala una retención prolongada, la combinación podría poner a prueba el apetito de riesgo de cara a mayo.
Monitor this month (AEST)
◆
14 April - JPMorgan Chase Q1 earnings
The first major bank to report. Management commentary on credit conditions, consumer spending, and the macro outlook will set the tone for financial sector earnings and broader market sentiment.
◆
15 April - Bank of America Q1 earnings
A read on consumer credit conditions and household financial health, particularly relevant given rising energy costs and the 4.4% unemployment rate.
◆
28-29 April - FOMC meeting and policy statement
The month's most consequential event. The statement and any updated forward guidance may effectively confirm whether rate cuts remain a possibility for 2026.
◆
Ongoing - Strait of Hormuz tanker traffic
A live indicator of energy supply risk. Any escalation or resolution carries immediate implications for oil prices, inflation expectations, and the Fed's options.
◆
Ongoing - Sovereign AI export restrictions
Developing policy around technology export curbs may affect capital expenditure plans for US technology firms, with knock-on implications for growth and employment in the sector.
The Bigger Picture
Geopolitical volatility has forced a rotation into energy and defence at the expense of growth oriented technology positions. The estimated US$650 billion AI infrastructure buildout is increasingly being scrutinised for returns on investment. If earnings season disappoints on that front, and if the FOMC signals a prolonged hold, the combination could test risk appetite heading into May.
Los mercados de Asia y el Pacífico comienzan abril con un enfoque en cómo la interrupción prolongada en el Estrecho de Ormuz alimenta la inflación, los flujos comerciales y las expectativas de políticas. El decimoquinto Plan Quinquenal de China desvía la atención hacia la inteligencia artificial y la autosuficiencia tecnológica, con efectos colaterales para las cadenas de suministro y el crecimiento regional. Japón y Australia se enfrentan al desafío de gestionar la inflación de energía importada mientras se miden hasta qué punto pueden normalizar la política sin descarrilar la demanda interna.
Para los comerciantes, la combinación de precios elevados de la energía y divergencia de políticas puede mantener la volatilidad elevada en los índices y monedas regionales.
Key watchlist
Top China data point
March exports (14 April)
Top Japan event
BOJ rate decision (27-28 April)
Top Australia event
March quarter CPI (29 April)
Main regional wildcard
Sovereign AI trade restrictions
Most sensitive market
Nikkei 225 / USD/JPY
Key threshold
Brent crude above US$110
China
Legisladores en Beijing han aprobado el 15º Plan Quinquenal (2026-2030), colocando la inteligencia artificial (IA) y la autosuficiencia tecnológica en el centro de la agenda nacional. El gobierno se ha fijado una meta de crecimiento de 4.5% a 5.0% para 2026, la más baja en décadas, ya que prioriza la calidad del crecimiento sobre la velocidad.
APAC Sections — GO Markets (Webflow embed snippets)
Key dates (AEST)
13
Apr
M2 money supply and new yuan loans
People's Bank of China
Medium
14
Apr
March balance of trade
General Administration of Customs
High
16
Apr
Q1 GDP and March industrial production
National Bureau of Statistics
High
What markets look for
Evidence of technology-driven industrial production growth consistent with Five-Year Plan priorities
March export resilience in the face of shifting global tariff frameworks
Signs of stabilisation in domestic consumer retail sales
Any implementation detail on the "new-type national system" for AI development
Why it matters for the region
China's shift toward high-value manufacturing and AI self-sufficiency could reshape regional supply chains and influence demand for commodities. A stronger-than-expected trade surplus may support broader regional sentiment, although higher energy costs can pressure margins for Chinese exporters and weigh on import demand. The 16 April GDP release carries the most weight as the first quarterly read on whether the 4.5%-5.0% target is tracking.
Japón
El Banco de Japón (BOJ) se enfrenta a una presión cada vez mayor para normalizar la política, ya que la inflación impulsada por la energía corre el riesgo de un resurgimiento. Si bien los precios al consumidor excluyendo los alimentos frescos se desaceleraron a 1.6% en febrero, el reciente repunte del precio del petróleo podría empujar al índice de precios al consumidor (IPC) de nuevo hacia la meta del 2% en los próximos meses.
Key dates (local / AEDT or AEST)
30
Mar
Tokyo CPI (March)
Statistics Bureau of Japan · Lead indicator for national trends (AEDT)
Medium
27–28
Apr
BOJ monetary policy meeting and outlook report
Bank of Japan · Live event for rate hike watch (AEST)
High
What markets look for
BOJ guidance on the timing of potential rate increases
March Tokyo CPI data as a lead indicator for national price trends
Updated inflation forecasts in the quarterly outlook report
Official comments on yen volatility and any reference to intervention thresholds
Why it matters
The BOJ remains a global outlier, with its short-term policy rate held at 0.75% after the March meeting, and any hawkish shift could trigger sharp moves in forex pairs involving the yen. Markets are weighing whether the BOJ can tighten policy while the government simultaneously resumes energy subsidies to shield households from rising oil costs. These competing pressures make the April meeting and outlook report unusually informative.
Australia
La economía australiana se mantiene en un estado de divergencia de dos velocidades, con hogares mayores aumentando el gasto mientras que las cohortes más jóvenes enfrentan importantes presiones de asequibilidad. Tras el aumento de la tasa del Banco de la Reserva de Australia (RBA) a 4.10% en marzo, los mercados están muy enfocados en los próximos datos de inflación para evaluar si puede ser necesario un endurecimiento adicional.
Key dates (AEST)
16
Apr
March unemployment rate
Australian Bureau of Statistics · 11:30 am AEST
Medium
29
Apr
March quarter CPI (Q1)
Australian Bureau of Statistics · 11:30 am AEST
High
30
Apr
March producer price index (PPI)
Australian Bureau of Statistics · 11:30 am AEST
Medium
What markets look for
Whether Q1 underlying inflation remains above the RBA's 2%-3% target band
Labour market resilience in the face of rising borrowing costs
The pass-through of global energy prices into domestic transport and logistics costs
RBA minutes (31 March) for any signal of internal policy disagreement
Why it matters
The 29 April CPI release may be the most consequential domestic data point before the RBA's May meeting. If inflation proves sticky or accelerates due to global energy shocks, the probability of a further rate increase could rise, with implications for both the Australian dollar and volatility across the ASX 200. The PPI reading the following day may also provide early signal on whether producer-level cost pressures are building in the pipeline.
Regional themes
◆
ASEAN demand signals
March trade data from Singapore and Malaysia may indicate whether regional electronics demand is holding up amid global uncertainty.
◆
India growth trajectory
Elevated energy costs could weigh on India's 2026 expansion plans, particularly following the New Delhi AI summit and associated infrastructure commitments.
◆
Commodity sentiment
Iron ore and thermal coal prices remain sensitive to signals from China's industrial policy and the pace at which Five-Year Plan priorities translate into actual demand.
◆
Currency pressure
Energy-importing economies across Asia and Europe may face sustained currency headwinds if Brent crude holds above US$100 for an extended period.
Seguimiento de temas de Asia-Pacífico y monitorizar los movimientos a medida que se despliegan. Abrir una cuenta · Iniciar sesión
April’s US earnings season is landing in a market that wants more than a good story. As GO Markets highlighted in its recent defence earnings watchlist, this reporting period is arriving after a broader shift in what markets care about. It is no longer just about growth at any cost. Traders want to know what the numbers are saying beneath the surface.
Why these 3 names matter
In this part of the market, that brings Tesla, NextEra Energy and Exxon Mobil into focus. Each offers a different read on a key 2026 theme: autonomy, electricity demand and oil supply risk.
Tesla: is being judged on whether autonomy and energy can support the next stage of growth
NextEra: offers a window into rising power demand and the infrastructure needed to meet it
Exxon Mobil: sits at the centre of the oil and energy security story as supply risks stay in focus
Taken together, these three names help explain where attention may be shifting. The question is no longer just who has the strongest narrative, rather, who can show real demand, firmer margins and execution that holds up in a more complicated backdrop.
In 2026, AI power demand is pushing utilities, storage and grid capacity into sharper focus while at the same time, oil supply risk has brought energy security back into the market conversation.
IMPORTANT: REPORTING SCHEDULES CAN CHANGE WITHOUT NOTICE. REPORTING DATES AND RELEASE TIMES ARE FROM COMPANY INVESTOR RELATIONS CALENDARS WHERE MARKED CONFIRMED; OTHERWISE THEY ARE GO MARKETS ESTIMATES. CONSENSUS EPS, REVENUE AND ANALYST-RANGE DATA ARE FROM THIRD-PARTY MARKET CONSENSUS SOURCES, AS OF 14 APRIL 2026 (AEST). COMPANY GUIDANCE, BACKLOG AND OPERATING METRICS ARE FROM THE LATEST COMPANY FILINGS OR RESULTS PRESENTATIONS UNLESS STATED OTHERWISE. FIGURES AND SCHEDULES MAY CHANGE WITHOUT NOTICE.
$TSLA| Q1 2026 REPORTING PERIOD
Tesla Inc.
NASDAQ | Consumer Discretionary | 22 Apr 2026
Confirmed
Global Release Countdown (AMC)
00:00:00:00
Consensus EPS
US$0.41
Consensus Revenue
US$22.26bn
AU/ASIA23 Apr | 6:05 am
US/LATAM22 Apr | 4:05 pm
Market Intelligence: $TSLA
Analysis: Tesla price drivers and scenarios
Auto Gross Margin
17-19%
Target floor, excl. credits
Megapack Growth
+25% YoY
Projected energy deployment
Analyst range
US$0.32-0.48
EPS estimate range
AVG
LOW US$0.32AVG US$0.41HIGH US$0.48
The US$0.16 analyst range shows there is still a lot of uncertainty. The main question is how weaker vehicle deliveries compare with stronger, higher-margin energy storage contributions. A result above US$0.48 would suggest the autonomy and battery story is improving faster than the bear case expects.
Key factors that could move the result
Automotive gross margin
This is the most important number for Tesla’s core business. Markets want to see whether price cuts have started to settle, or whether margins are still under pressure.
Benchmark: 17% (excluding credits)
Energy storage (Megapacks)
This is the more durable growth story. Strong Megapack deployment and battery margins could help offset weaker vehicle deliveries
Focus: Storage growth versus pressure in the auto business
Full Self-Driving (FSD) & Robotaxi
This is the main narrative driver. Markets will watch for updates on FSD adoption and the robotaxi timeline to judge whether the move towards “physical AI” is becoming more credible.
Watch: Timing for next-generation autonomy technology
Regulatory credits
This is a quality check on the result. If EPS is boosted too much by credit sales, some traders may see the beat as less durable.
Watch: How much credit sales contribute to final EPS
Trade Execution: $TSLA
Earnings reaction framework: Q1 2026
Bull case
EPS above US$0.45, energy margins at 20%+ | FSD take rates rising
The result clears the top-tier analyst range. Commentary focuses on FSD scaling and Megapack production ramps rather than vehicle discounting. FY26 guidance is reaffirmed.
Possible reaction: stronger momentum, with short covering adding support
Base case
EPS between US$0.38 and US$0.43, auto margins stable | Near target
The result is close to expectations, but there is no major surprise from the energy business. The market stays focused on the robotaxi timeline. The initial move may be limited if the product mix looks unchanged.
Possible reaction: range-bound trading or a muted early response
Bear case
EPS below US$0.35, auto margins drop below 16% | Signs of FSD delays
The result misses even cautious expectations. Rising inventory suggests more discounting may be needed. The market starts to question whether the level of spending on AI and autonomy is too high.
Possible reaction: rotation out of the stock, especially if growth confidence weakens
Sentiment Analysis · Tesla Inc.
Interactive scenario analysis: $TSLA
Select earnings outcome
Growth momentum
Strong result, helped by energy and FSD
FSD and Energy do better than expected, which helps offset weaker car deliveries. Management gives the market more confidence that autonomy is getting closer to real revenue. Auto margins staying above 17% would also help.
EPS Outcome
Above US$0.45
Energy Signal
On track
Margins
At or above 17%
Possible reaction
Strong rally
Sources & Data Methodology
Sources: Reporting dates and release times are from company investor relations calendars where marked Confirmed; otherwise they are GO Markets estimates. Consensus EPS, revenue and analyst-range data are sourced from Bloomberg and Earnings Whispers, as at 14 April 2026 (AEDT). Company guidance, backlog and operating metrics are sourced from the latest company filings, results presentations or investor relations materials unless stated otherwise. Any scenario analysis reflects GO Markets analysis. Figures and schedules may change without notice.
Expanded Coverage
AI isn’t the only trade this earnings season.
From data centres to defence, see why JPMorgan and the big defence players are on our radar for March.
If Tesla is the market’s test of whether physical AI can become a business, NextEra is a test of whether the power buildout behind AI is starting to show up more clearly in utility economics.
That is what makes the shift from Tesla to NextEra interesting: one is about ambition and platform narrative and the other is about power, contracts, infrastructure and return on capital.
$NEE| Q1 2026 REPORTING PERIOD
NextEra Energy, Inc.
NYSE | Utilities | 23 Apr 2026
Confirmed
Global Release Countdown (BMO)
00:00:00:00
Consensus EPS
US$0.91
Consensus Revenue
US$7.17bn
AU/ASIA23 Apr | 9:35 pm
US/LATAM23 Apr | 7:35 am
Market Intelligence: $NEE
Analysis: NEE price drivers and scenarios
Backlog
About 29.8 GW
Total Energy Resources backlog
Growth target
8%+ a year
Adjusted EPS growth through 2032
Analyst range
US$0.88-1.06
Q1 EPS estimate range
AVG
LOW US$0.88AVG US$0.92HIGH US$1.06
The main question is simple: can NextEra turn big growth plans into real progress? Traders want to see whether rising power demand, especially from AI, is starting to show up in results, contracts and project execution.
Trade Execution: $NEE
Key signals to watch
Contract conversion
One of the biggest proof points. Markets want to see whether strong customer interest is turning into signed agreements and clearer revenue visibility.
Signal: More large-load agreements signed
Natural gas and power buildout
Traders will watch for clearer milestones on the approved gas buildout and capacity plan to meet rising power demand.
Focus: Buildout timeline and project execution
Funding and capital discipline
Investors will want to know whether funding plans look manageable after the recent equity raise and the impact of financing costs.
Watch: Funding risk and capital pressure
Rate base and earnings outlook
Markets look for healthy rate-base growth and signs that rising demand can support long-term earnings growth.
Focus: Guidance, rate-base growth and EPS visibility
Sentiment Analysis · NextEra Energy
Interactive scenario analysis: $NEE
Select earnings outcome
Upside momentum
Strong result, backed by real progress
EPS comes in above US$1.06. Management shows better contract progress and clearer steps on new power projects. That would suggest the backlog is moving closer to real revenue.
EPS Outcome
Above US$1.06
Infrastructure Signal
More contracts signed
Possible reaction
Sentiment improves
Sources & Data Methodology
Sources: Reporting dates and release times are from company investor relations calendars where marked Confirmed; otherwise they are GO Markets estimates. Consensus EPS, revenue and analyst-range data are sourced from Bloomberg and Earnings Whispers, as at 14 April 2026 (AEDT). Company guidance, backlog and operating metrics are sourced from the latest company filings or results presentations. Any scenario analysis reflects GO Markets analysis. Figures and schedules may change without notice.
From power to oil
If NextEra reflects the electricity side of the real economy story, Exxon Mobil reflects the fuel side. That matters in a market where supply risk can still reset inflation expectations, shift sector leadership and change how traders think about defensiveness.
$XOM| Q1 2026 REPORTING PERIOD
Exxon Mobil Corporation
NYSE | Energy | 1 May 2026
Confirmed
Global Release Countdown (BMO)
00:00:00:00
Consensus EPS
US$1.66
Consensus Revenue
US$82.47bn
AU/ASIA1 May | 8:30 pm
US/LATAM1 May | 6:30 am
Market Intelligence: $XOM
Analysis: XOM price drivers and scenarios
Liquids pricing effect
US$1.9-2.3bn
Support from stronger oil prices
Energy products timing
-US$3.3-4.1bn
Downstream timing drag
Analyst range
US$1.60-$1.85
Q1 EPS estimate range
AVG
LOW US$1.60AVG US$1.66HIGH US$1.85
The key question for Exxon Mobil is straightforward: can stronger oil and gas pricing offset weaker volumes and downstream pressure? For traders, this is a test of earnings quality, if prices do the lifting, the market may still want proof that operations are holding up.
Trade Execution: $XOM
Key signals to watch
Realised pricing
Markets want to see whether stronger oil and gas prices were enough to offset weaker production volumes.
Signal: Price strength vs Volume pressure
Timing and quality
Commentary on whether the downstream timing drag is temporary or a sign of deeper margin pressure.
Focus: Accounting effect vs Headwind
Guyana and Upstream
Markets want steady production growth from Guyana to keep the long-term story intact.
Watch: Delivery and Resilience
Refining margins
Even if crude helps, weaker refining or chemicals performance could limit the overall upside.
Focus: Downstream offset levels
Sentiment Analysis · Exxon Mobil
Interactive scenario analysis: $XOM
Select earnings outcome
Pricing offsets disruption
Strong result, with pricing support doing enough
EPS above US$1.85. Higher realised pricing more than offsets weaker volumes, and management suggests timing drag was less severe than expected. Upstream updates stay constructive.
EPS Outcome
Above US$1.85
Timing Impact
Smaller than feared
Possible reaction
Sentiment improves
Sources & Data Methodology
Sources: Reporting dates from company investor relations calendars; otherwise they are GO Markets estimates. Consensus EPS, revenue and analyst-range data from Bloomberg and Earnings Whispers as at 14 April 2026 (AEDT). Any scenario analysis reflects GO Markets analysis. Figures and schedules may change without notice.
The Bottom Line
The 2026 Reality Check
This late-April energy cluster is about more than three company reports. It is a live test of what the market wants to pay for in 2026.
Tesla ($TSLA)
Autonomy and energy shifting from promise to proof.
NextEra ($NEE)
Electricity demand turning into practical utility growth.
Exxon ($XOM)
Oil strength translating into durable earnings power.
Taken together, they offer a useful read on the part of the market that looks more physical, more capital-intensive and, for many traders, more real.
Your next earnings setup starts here
Stay ahead of major beats, misses, and market surprises. Log in to your terminal, open a new account, or explore our dedicated earnings academy.
El anuncio del alto el fuego del 8 de abril y las discusiones paralelas en torno a una tregua de 45 días no han resuelto la interrupción del Estrecho de Ormuz. Por ahora, han puesto un tope al peor escenario posible, pero el tráfico de petroleros se mantiene en una fracción de los niveles normales y la demanda iraní de tarifas de tránsito señala un cambio estructural, no temporal.
Lo que comenzó como un conflicto regional se ha convertido en un shock energético global, y la pregunta para los mercados ya no es si Ormuz fue interrumpido, sino cómo permanentemente la interrupción cambia el piso de precios para el petróleo.
Puntos clave
Alrededor de 20 millones de barriles por día (bpd) de petróleo y productos derivados del petróleo normalmente pasan por el Estrecho de Ormuz entre Irán y Omán, lo que equivale a aproximadamente una quinta parte del consumo mundial de petróleo y aproximadamente el 30% del comercio mundial de petróleo marítimo.
Esto es un choque de flujo, no un problema de inventario. Los mercados petroleros dependen del rendimiento continuo, no del almacenamiento de información estático.
Si la interrupción persiste más allá de unas pocas semanas, el Brent podría pasar de un pico a corto plazo a un shock de precios más amplio, con riesgo de estanflación.
El tráfico de petroleros a través del estrecho cayó de alrededor de 135 barcos por día a menos de 15 en el pico de interrupción, una reducción de aproximadamente 85%, con más de 150 embarcaciones ancladas, desviadas o retrasadas.
El 8 de abril se anunció un alto el fuego de dos semanas, con negociaciones de tregua de 45 días en curso. Irán ha señalado por separado una demanda de tarifas de tránsito para los buques que utilizan el estrecho, lo que, de formalizar, representaría un piso geopolítico permanente en los costos de energía.
Los mercados han comenzado a alejarse del crecimiento y la exposición tecnológica hacia los nombres de energía y defensa, lo que refleja la opinión de que el petróleo elevado se está convirtiendo en un costo estructural en lugar de una prima de riesgo temporal.
Institutional Grade Performance
Master the Markets with MetaTrader 5
Trade hundreds of instruments with superior speed and advanced technical analysis. Harness full EA functionality to execute your strategy.
El punto de choque petrolero más crítico del mundo
El Estrecho de Ormuz maneja aproximadamente 20 millones de barriles diarios de petróleo y productos derivados del petróleo, lo que equivale a alrededor del 20% del consumo mundial de petróleo y alrededor del 30% del comercio mundial de petróleo marítimo. Con la demanda mundial de petróleo cercana a los 104 millones de bpd y la capacidad sobrante limitada, el mercado ya estaba fuertemente equilibrado antes de la última escalada.
El estrecho también es un corredor crítico para el gas natural licuado. Alrededor de 290 millones de metros cúbicos de GNL transitaron por la ruta cada día en promedio en 2024, lo que representa aproximadamente el 20% del comercio mundial de GNL, siendo los mercados asiáticos el principal destino.
La Agencia Internacional de Energía (AIE) ha descrito a Ormuz como el punto de choque del tránsito petrolero más importante del mundo, señalando que incluso las interrupciones parciales pueden desencadenar movimientos desmedidos de precios. El crudo Brent se ha movido por encima de los 100 dólares el barril, lo que refleja tanto la estanqueidad física como una prima de riesgo geopolítico al alza.
Fuente: Administración de Información Energética de Estados Unidos, de fecha 17 de junio de 2025, utilizando el promedio diario de 2024
Tanques inactivos a medida que los flujos son lentos
Los datos de envío y seguros ahora apuntan a tensión en tiempo real. Se informa que más de 85 grandes transportistas de crudo están varados en el Golfo Pérsico, mientras que más de 150 embarcaciones han sido ancladas, desviadas o retrasadas a medida que los operadores reevalúan la cobertura de seguridad y seguros. Eso dejaría un estimado de 120 millones a 150 millones de barriles de crudo inactivos en el mar.
Esos volúmenes representan solo de seis a siete días de rendimiento normal de Hormuz, o un poco más de un día de consumo mundial de petróleo.
Los datos actualizados de envío y seguros confirman ahora que más de 150 embarcaciones han sido ancladas, desviadas o retrasadas, por encima de las 85 reportadas inicialmente. Los 1.3 días de cobertura de consumo mundial del crudo inactivo siguen siendo la limitación vinculante: se trata de un shock de flujo, no un problema de almacenamiento, y el alto el fuego aún no se ha traducido en un rendimiento restaurado de manera significativa.
🌋 Trump, volatility and Hormuz.
As tariff shocks collide with a ten year extreme in oil positioning, the margin for error is zero. See the technical markers and safe haven pivots defining the current risk environment.
Un mercado basado en el flujo, no en el almacenamiento de información
Los mercados petroleros funcionan en movimiento continuo. Las refinerías, las plantas petroquímicas y las cadenas de suministro mundiales están calibradas para lograr entregas estables a lo largo de rutas marítimas predecibles. Cuando los flujos a través de un punto de choque que lleva aproximadamente una quinta parte del consumo mundial de petróleo y alrededor del 30% del comercio mundial de petróleo marítimo se interrumpen, el sistema puede pasar del equilibrio al déficit en cuestión de días.
La capacidad de producción sobrante, concentrada en gran medida dentro de la OPEP, se estima en sólo 3 millones a 5 millones de bpd. Eso queda muy por debajo de los volúmenes en riesgo si los flujos de Ormuz se ven gravemente perturbados.
GO Markets — Idle Tankers: Days of Cover
Oil market analysis
How long do idle tankers last?
135M idle barrels — days of cover against each demand benchmark
vs. Strait of Hormuz daily flow (20M bbl/day)
6.75 daysof Hormuz throughput covered
6.75 days
0
5
10
15
20
25
30 days
vs. Global oil consumption (104M bbl/day)
1.3 daysof world demand covered
1.3 days
0
5
10
15
20
25
30 days
vs. US Strategic Petroleum Reserve release (1M bbl/day)
135 daysof full SPR release pace covered
135 days — but SPR exists to replace this role
0
5
10
15
20
25
30 days
135M
idle barrels on tankers (midpoint of 120–150M range)
~33%
of daily Hormuz flow that is idle storage, not transit
<31 hrs
is all idle storage against global daily consumption
Indicative market trajectories based on disruption severity
Scenarios for the weeks ahead
1–2 WEEKS
Ceasefire catch-up
Markets face catch-up repricing. Brent could consolidate in the US$105–US$115 range as risk premia unwind. Brent may trade lower (US$95–US$110) if strategic stocks bridge the temporary shortfall.
2–4 WEEKS
Infrastructure blitz
Shifts to structural supply shock. Brent moving toward US$150–US$200 cannot be ruled out. This is the stagflation trigger where energy costs constrain central bank flexibility.
STRUCTURAL
Geopolitical floor
Iran's transit fee demand creates a permanent input cost. The pre-crisis price structure (US$60–US$70) may not return, embedded in insurance and freight rates.
Critical Threshold
US$120 remains the level at which energy inflation becomes a direct Federal Reserve policy problem.
Riesgos de inflación y macroderrames
El impacto inflacionario de un choque petrolero suele llegar en oleadas. Los precios más altos del combustible y la energía pueden elevar rápidamente la inflación general a medida que los costos de gasolina, diésel y energía se muevan al alza.
Con el tiempo, los mayores costos de energía pueden pasar por fletes, alimentos, manufactura y servicios. Si la perturbación persiste, la combinación de una inflación elevada y un crecimiento más lento podría elevar el riesgo de un entorno estanflacionario y dejar a los bancos centrales enfrentando una difícil compensación.
🛢️ Brent hits $100.
Exxon and SLB are leading the rotation out of tech. Get the price targets and technical support levels for the top 5 energy majors.
Sin compensación fácil, un sistema con poca holgura
Lo que hace que el episodio actual sea particularmente agudo es la falta de holgura en el sistema global.
La oferta y la demanda mundiales cerca de 103 millones a 104 millones de bpd dejan poco colchón de sobra cuando un punto de choque que maneja casi 20 millones de bpd, o cerca de una quinta parte del consumo mundial de petróleo, se ve comprometido. La capacidad sobrante estimada de 3 millones a 5 millones de bpd, en su mayoría dentro de la OPEP, cubriría sólo una fracción de los volúmenes en riesgo.
Las rutas alternativas, incluidas las tuberías que eluden Ormuz y el envío reencaminado, solo pueden compensar parcialmente los flujos perdidos, y generalmente a un costo más alto y con plazos de entrega más largos.
Conclusión
Hasta que se restablezca el tránsito por el Estrecho de Ormuz y se vea como creíblemente seguro, es probable que los flujos mundiales de petróleo sigan deteriorados y las primas de riesgo sean elevadas. Para los inversionistas, los formuladores de políticas y los tomadores de decisiones corporativas, la pregunta central es si el petróleo puede moverse hacia donde necesita ir, todos los días, sin interrupción.
Market Opportunity
Don't just watch the squeeze. Trade the framework.
As positioning gaps hit decade extremes, access advanced charting tools and real time execution on the six key markets defining this cycle.
Un titular sobre una civilización que “muere esta noche” está construido para abrumar, pero la señal más clara puede ser la calma que hay debajo de ella, porque los mercados están empezando a tratar este ciclo de fuerte escalada seguido de una desescalada repentina como un patrón, no una sorpresa.
En los macrocírculos, ese patrón tiene una etiqueta contundente: TACO, o “Trump siempre se arruina”. La frase está cargada, pero la lógica es simple. Una amenaza de presión máxima golpea, los activos de riesgo se tambalan, luego aparece una pausa, un retraso o un resultado más suave una vez que el costo económico comienza a picar.
Eso no significa que el riesgo sea pequeño. Puede significar que los inversores se han acostumbrado a un guión en el que la retórica se destella, los mercados absorben el choque y la moderación aparece antes de que el peor de los casos aterrice por completo.
Developing situation
|
Strait of Hormuz | Section 122 Tariffs
PublishedApril 2026
Brent CrudeAbove US$100
VIX31
In focus6 markets
Oil PositioningDecade-low longs
The Framework & MechanismIs the market the red line?
+
This is where the TACO idea starts to matter. Traders are not just watching the rhetoric. They are watching when it starts to hit markets, inflation and the wider economy.
Oil is at the centre of that risk. If disruption around the Strait of Hormuz starts to threaten global energy flows, the story quickly becomes macro. Higher oil can lift inflation expectations, pressure central banks and tighten financial conditions.
That is why a pause can look less like diplomacy and more like pressure relief. The real red line may be the point where the economic damage becomes too obvious to ignore.
Short Squeezed
Positioning adds another layer. Oil still looks under-owned, with futures positioning near decade-long bearish extremes. If a fresh shock lands, short-covering could drive prices higher much faster than fundamentals alone would suggest.
That is the short-squeeze risk. In the Commitment of Traders (COT) report, recent data suggests oil long exposure is relatively low by historical standards.
Humanitarian Reality
Whatever may be promised in political messaging, any sustained conflict in Iran would carry a heavy cost in displacement, infrastructure damage and wider regional stress. A relief rally in markets does not change that.
Global Isolation
Even if pauses are used to steady domestic market sentiment, allies and multilateral institutions may view bluff-and-retreat tactics as a credibility problem that creates longer-term diplomatic friction.
Positioning gap indicator
Divergence analysis between positioning and risk environment
APRIL 2026
Bars show GO Markets’ internal estimate of the divergence between current futures positioning and levels seen in comparable historical shock environments.
Brent crudeExtreme
Gold (XAU/USD)Very high
Nasdaq 100High
USD/CNHHigh
US 10 yr yieldMedium
USD/CADMedium
Extreme decade scale positioning extreme
High significant divergence
Medium moderate divergence
Methodology note
The Positioning Gap Indicator is based on GO Markets’ internal analysis and is intended as a high-level, illustrative framework only. It uses a combination of market positioning data, historical comparisons and discretionary assumptions about how similar energy and trade shocks have affected markets in the past. The ‘Extreme’, ‘Very High’, ‘High’ and ‘Medium’ labels are relative internal classifications, not objective market standards, and should not be relied on as predictions, forecasts or a guarantee of future outcomes.
The Six Markets
The six markets that matter most
Each of these six markets is exposed to the current situation through a different mechanism. Understanding the mechanism, not just the price, matters. It helps explain whether a move is a headline reaction or the start of something broader. Tap any card to expand the full analysis.
01
BRENT
Brent crude oil
ENERGYDIRECT CHANNELSQUEEZE RISK: EXTREME
+
The Clear Transmission Channel
Brent is the international benchmark for crude and the most direct transmission mechanism in this geopolitical thesis. Any disruption to physical flows, particularly through the Strait of Hormuz, forces an immediate tightening of global energy supply.
The Positioning Backdrop
Futures positioning currently sits at a ten year bearish extreme. Leveraged funds have cut long exposure heavily. In the event of a physical supply shock, this imbalance creates the potential for a violent short covering squeeze.
● Bull Case
Hormuz disruption extends beyond four weeks. Extended disruption could lift Brent sharply if supply flows are impaired for longer.
● Bear Case
Diplomatic intervention reopens the strait quickly. Strategic petroleum reserve (SPR) releases and increased spare capacity cap any price rally.
Strategic Marker
US$120: the point at which energy inflation becomes a direct Federal Reserve policy problem, rather than just a market narrative.
02
XAU/USD
Gold
SAFE HAVENUNDER-OWNEDSQUEEZE RISK: VERY HIGH
+
The Counter-Intuitive Setup
Despite a clear geopolitical risk profile, leveraged funds have been reducing bullish gold exposure. This leaves the market under-owned at the exact moment the fundamental case for safe haven assets is strengthening.
The Inflation Variable
The critical factor for Gold is whether energy-driven inflation limits the Fed's room to maneuver. If policy flexibility weakens, Gold could catch up quickly as a hedge against stagflation.
● Bull Case
Real yields fall as energy inflation outpaces rate hikes. Under-owned positioning amplifies the catch up move as institutional funds rebuild exposure.
● Bear Case
Geopolitical tensions ease rapidly. The Fed remains credibly focused on inflation, keeping real yields positive and supporting the USD over Gold.
Strategic Marker
One level to monitor is prior resistance, alongside any change in COT positioning.
03
US100/NAS100
Nasdaq 100
TECHNOLOGYDUAL PRESSURERATE AND SUPPLY RISK
+
Why it is a complicated position
The Nasdaq faces immediate pressure from two fronts: Stickier energy-driven inflation forces rates higher for longer, compressing multiples, while trade tensions unsettle the supply chains beneath major tech names.
Why the 10 year yield matters here
When the 10 year Treasury yield holds above 4.5%, the future value of technology earnings must be discounted at a higher rate. AI linked earnings momentum must overpower this valuation headwind.
● Bull Case
Earnings season delivers proof of AI investment generating real revenue. Index components successfully insulate supply chains, and AI capex momentum overrides the macro headwind.
● Bear Case
Energy inflation keeps yields above 4.5%. Multiple compression in high valuation names triggers a broader index decline amid disappointments in AI monetization.
Strategic Marker
S&P 500 at 6,498: a widely watched Fibonacci cluster. A sustained move below this threshold highlights a historically challenging framework for growth equities.
04
USD/CNH
US dollar/offshore Chinese yuan
FXBEIJING READPOLICY PROXY
+
What it tells you
USD/CNH is the cleanest real time read on how Beijing is responding to tariff pressure. A sharp rise suggests China is allowing currency weakness to absorb the costs of trade friction.
Why it matters beyond China
A move in USD/CNH doesn't stay contained. It spills into Asian equities, commodity demand, and broader risk appetite. Deliberate depreciation signals a shift in the global trade environment.
● USD Bull / Yuan Bear
Beijing allows yuan weakness as a deliberate countermeasure. Capital outflows accelerate, and USD safe haven demand reinforces the move.
● Yuan Recovery
Trade negotiations begin and a face saving off ramp is found. PBOC intervention defends the yuan, and the dollar's safe haven premium fades.
Strategic Marker
7.30 on USD/CNH: a sustained move above this has historically been associated with broader risk off moves in Asian markets.
05
US10Y/TNOTE
US 10 year Treasury yield
RATESMACRO PLUMBINGSHAPES EVERYTHING ELSE
+
Why it sits under everything
The 10 year yield shapes mortgage costs, corporate borrowing, and the valuation framework for risk assets globally. When it rises, borrowing becomes more expensive across the entire system.
The Independent Movement Risk
If oil forces the Fed to delay cuts, the 10 year yield could rise regardless of Fed communication. It can tighten financial conditions even before a formal policy shift occurs.
● Rates Fall Case
Oil shock proves transient. Fed maintains guidance and 10 year yields pull back toward 4.0%, relieving pressure on equities and providing support for bonds.
● Rates Rise Case
Sustained oil above US$100 pushes inflation higher. Fed pauses rate cut language and the 10 year yield breaks above 4.5%, compressing equity multiples.
Strategic Marker
4.5% on the 10 year yield: a sustained break above this while oil remains above US$100 is a historically challenging combination for equities.
06
USD/CAD
US dollar/offshore Canadian dollar
FXOIL-LINKEDLEAD INDICATOR
+
The Double Exposure
USD/CAD is a lead indicator because Canada sits at the intersection of energy and trade. It benefits from higher oil revenue but is highly sensitive to US economic and trade conditions.
When the Forces Collide
When oil rises, the CAD often strengthens; when trade stress rises, it weakens. In the current environment, these forces are colliding rather than canceling each other out.
● CAD Strengthens
Oil sustained above US$100 boosts export revenue while trade tensions stay short of Canada specific tariffs. Bank of Canada holds rates steady.
● CAD Weakens
Safe haven USD demand outweighs the oil benefit. Bank of Canada cuts rates to offset trade headwinds.
Strategic Marker
1.42 on USD/CAD: a sustained move above this signals trade anxiety is dominating the oil benefit, often preceding broader risk off moves.
What could go wrong
Four reasons the market logic could fail
+
A coherent macro case is still only a case. Markets regularly ignore tidy narratives for longer than expected, or invalidate them quickly. Four failure paths stand out.
1
The situation de-escalates faster than the news cycle suggests
Geopolitical risk premia can build slowly and disappear quickly. Any credible sign of de-escalation, especially around shipping lanes or energy infrastructure, could reverse oil sharply and drain urgency from the rest of the thesis. This is precisely the scenario the TACO framework predicts.
2
Tariff posturing does not become tariff policy
The market may be reacting to opening positions rather than settled policy. If Washington and Beijing find a face-saving off-ramp, as they have in previous trade disputes, currency and equity moves that anticipated escalation could unwind just as fast as they built.
3
AI investment spending overrides the macro headwind
Technology capital expenditure has remained more resilient than expected for much of the past two years. If earnings season shows that AI infrastructure spending is still translating into real demand and returns, the growth narrative may reassert itself, particularly in the Nasdaq 100.
4
The squeeze never arrives: extended positioning holds for longer than expected
Stretched positioning does not automatically produce a violent reprice. Markets can stay under-owned for months if risk appetite remains weak and institutions are unwilling to rebuild exposure. The set-up can exist without the catalyst arriving in a way that forces the move.
Forward Calendar
What to watch and when
+
Three time horizons matter here. The first tests supply resilience. The second tests financial system health. The third tests whether any shift in market leadership is cyclical or structural.
Three horizon watchlist
Signals and catalysts across the next two months
Next Two Weeks
Chipmaker guidance and supply commentary
Major semiconductor earnings calls will offer an early read on whether supply bottlenecks are worsening and whether management teams are changing production assumptions. If supply commentary deteriorates, the inflation story gets another push and the case for higher for longer rates strengthens.
Next 30 Days
Bank earnings and loan demand
Major US banks will provide a useful check on whether capital spending related to AI infrastructure is still being financed. The most important signal may not be earnings per share. It may be commercial loan demand. If businesses are pulling back on borrowing, the growth cycle may be softening earlier than the market expects.
Next 60 Days
Enablers versus spenders
The more structural test is whether the market begins rewarding businesses that produce physical outputs: energy producers, hardware makers and defence contractors, while penalising software companies that still cannot prove a clear return on AI spending. A wider performance gap between those groups would suggest something deeper than a temporary rotation.
El camino por delante
La actual convergencia de la tensión geopolítica y los extremos de posicionamiento histórico ha creado un entorno único de “primavera enrollada” para los mercados globales. Mientras que el TACO marco sugiere un patrón de fuerte escalada seguido de pausas estratégicas, la prueba real para los comerciantes en los próximos 60 días será la transición de la volatilidad impulsada por los titulares a la rotación estructural del mercado.
Ya sea que la brecha de posicionamiento se cierre a través de una suave desescalada o un apretón corto violento, tener un marco de reacción definido puede ayudar a los comerciantes a navegar por el ruido.
Market Opportunity
Don't just watch the squeeze. Trade the framework.
As positioning gaps hit decade extremes, access advanced charting tools and real time execution on the six key markets defining this cycle.