

Global markets enter a catalyst-dense week where multiple central bank decisions, ongoing US earnings, and the Reserve Bank of Australia (RBA) rate decision may help shape near-term direction.
- RBA rate decision: Market expectations lean towards a Target Cash Rate increase.
- Global central banks: The European Central Bank (ECB) and Bank of England (BoE) both communicate within the same week, creating the potential for policy cross-currents.
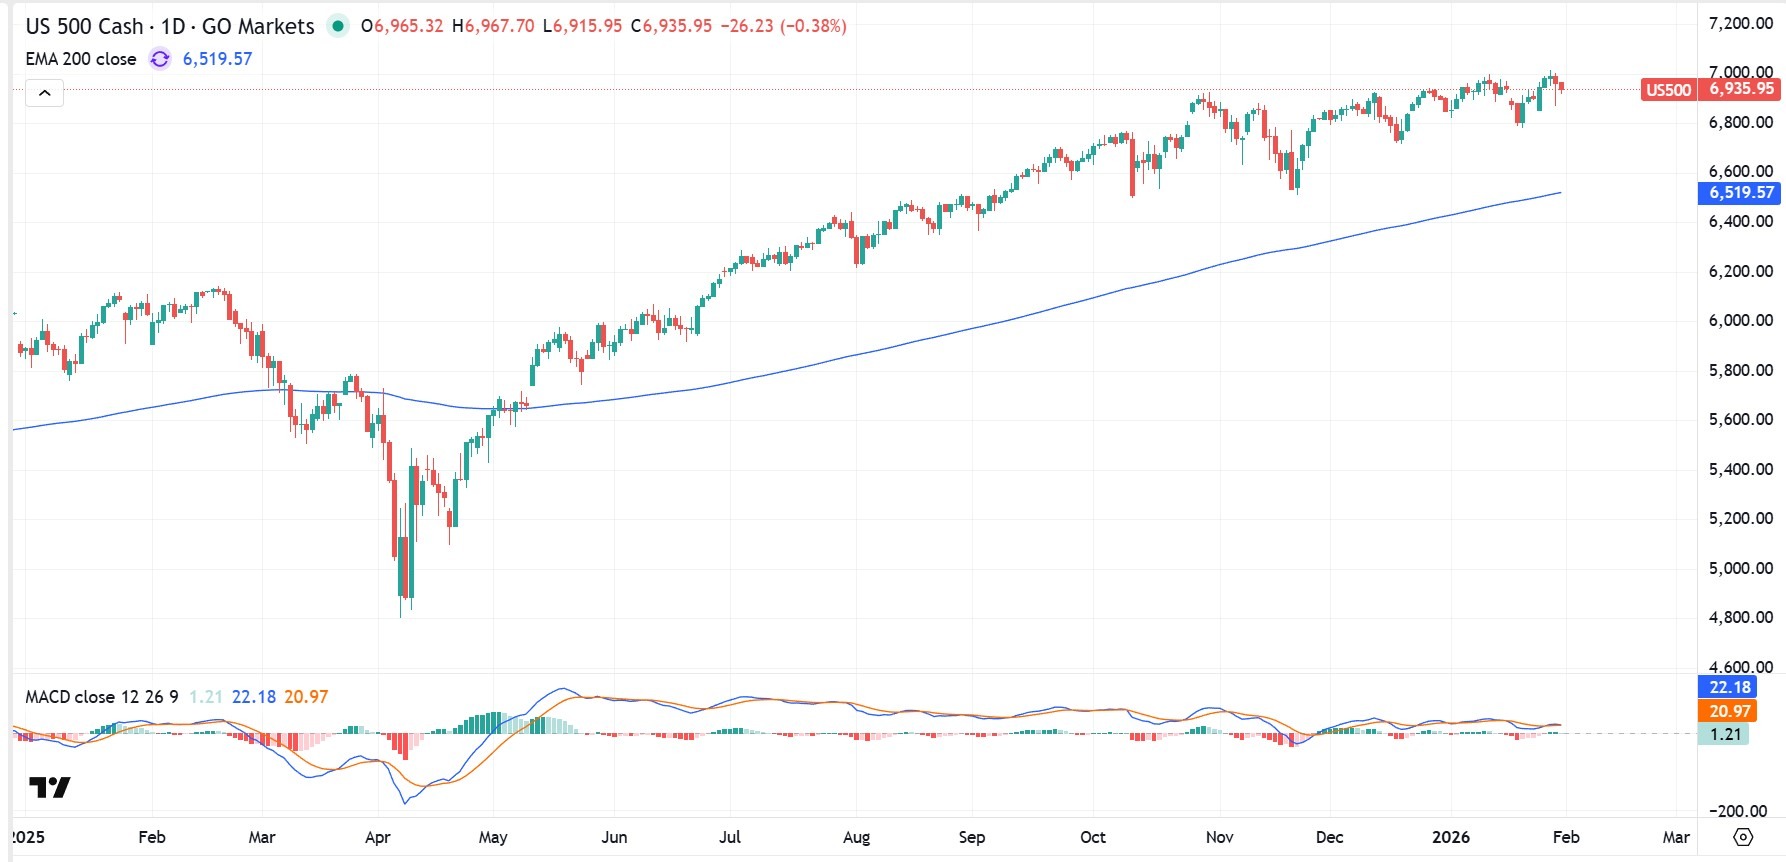
- US earnings: The earnings cycle continues with Alphabet and Amazon reporting this week.
- Gold: Trading near elevated levels amid macro uncertainty and shifting rate expectations.
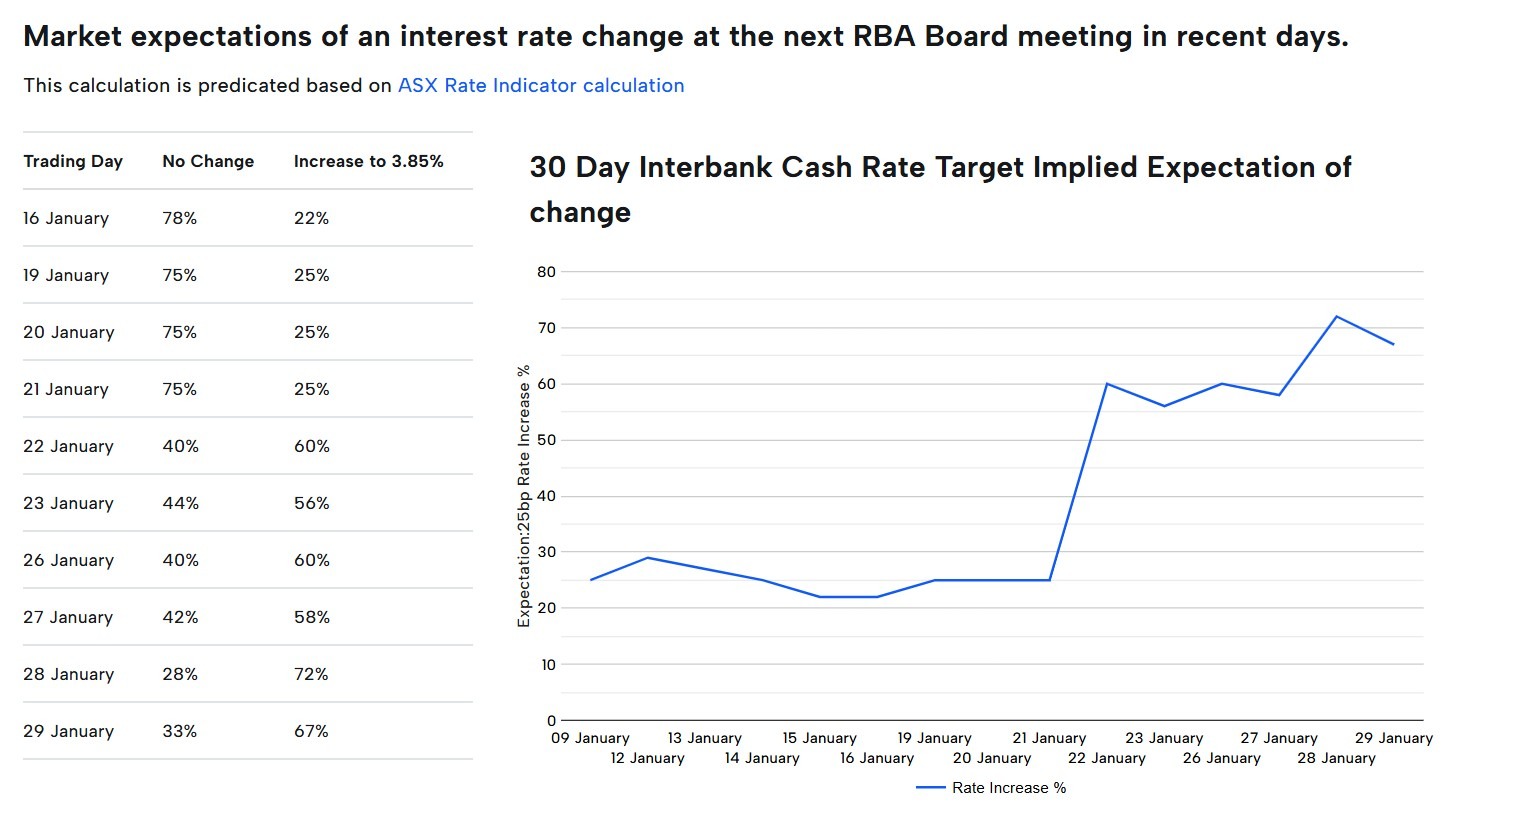
RBA rate decision
- RBA decision Tuesday, 3 February, 2:30 pm (AEDT)
- RBA media conference: Tuesday, 3 February, 3:30 pm (AEDT)
A 67% likelihood of a rate rise is suggested on the RBA rate-tracker within the futures pricing framework, indicating a market-implied probability of a move.
Market impact
- AUD pairs may respond quickly to any repricing of the rate path.
- Rate-sensitive equity sectors could see rotation.
- Government bond yields may adjust if expectations shift.
ECB and BoE of England
Key decision timing
- ECB monetary policy meeting: 4–5 February
- BoE announcement: Thursday, 5 February
When several major central banks communicate within the same window, markets often focus on forward guidance as much as the decisions themselves.
Market impact
- EUR and GBP volatility may increase around policy communication.
- Relative yield expectations could influence capital flows.
- Equity sentiment may respond to shifts in liquidity assumptions.
US earnings continue
The earnings cycle remains active, with investors typically focusing on guidance, margins, and capital expenditure alongside headline results.
After an extended equity advance, consistent outcomes may help stabilise sentiment, while disappointments can influence short-term positioning.
Scheduled earnings
- Walt Disney: Monday, 2 February (US time)/ Tuesday, 3 February (AEDT)
- Palantir Technologies: Monday, 2 February (US time)/ Tuesday, 3 February (AEDT)
- Advanced Micro Devices: Tuesday, 3 February (US time)/ Wednesday, 4 February (AEDT)
- PayPal: Tuesday, 3 February (US time, after market close)/ Wednesday, 4 February (AEDT)
- Alphabet: Wednesday, 4 February (US time, after market close)/ Thursday,5 February (AEDT)
- Amazon: Thursday, 5 February (US time, after market close)/ Friday, 6 February (AEDT)
Additional notable reporters across the week include Eli Lilly, PepsiCo, Qualcomm, Ford, and Roblox.
*All above dates observed as of 30 January 2026; dates subject to change.
Market impact
- Index moves may hinge on guidance durability across companies.
- Volatility may cluster around major releases.
- First reporters in each sector may influence other companies yet to report.
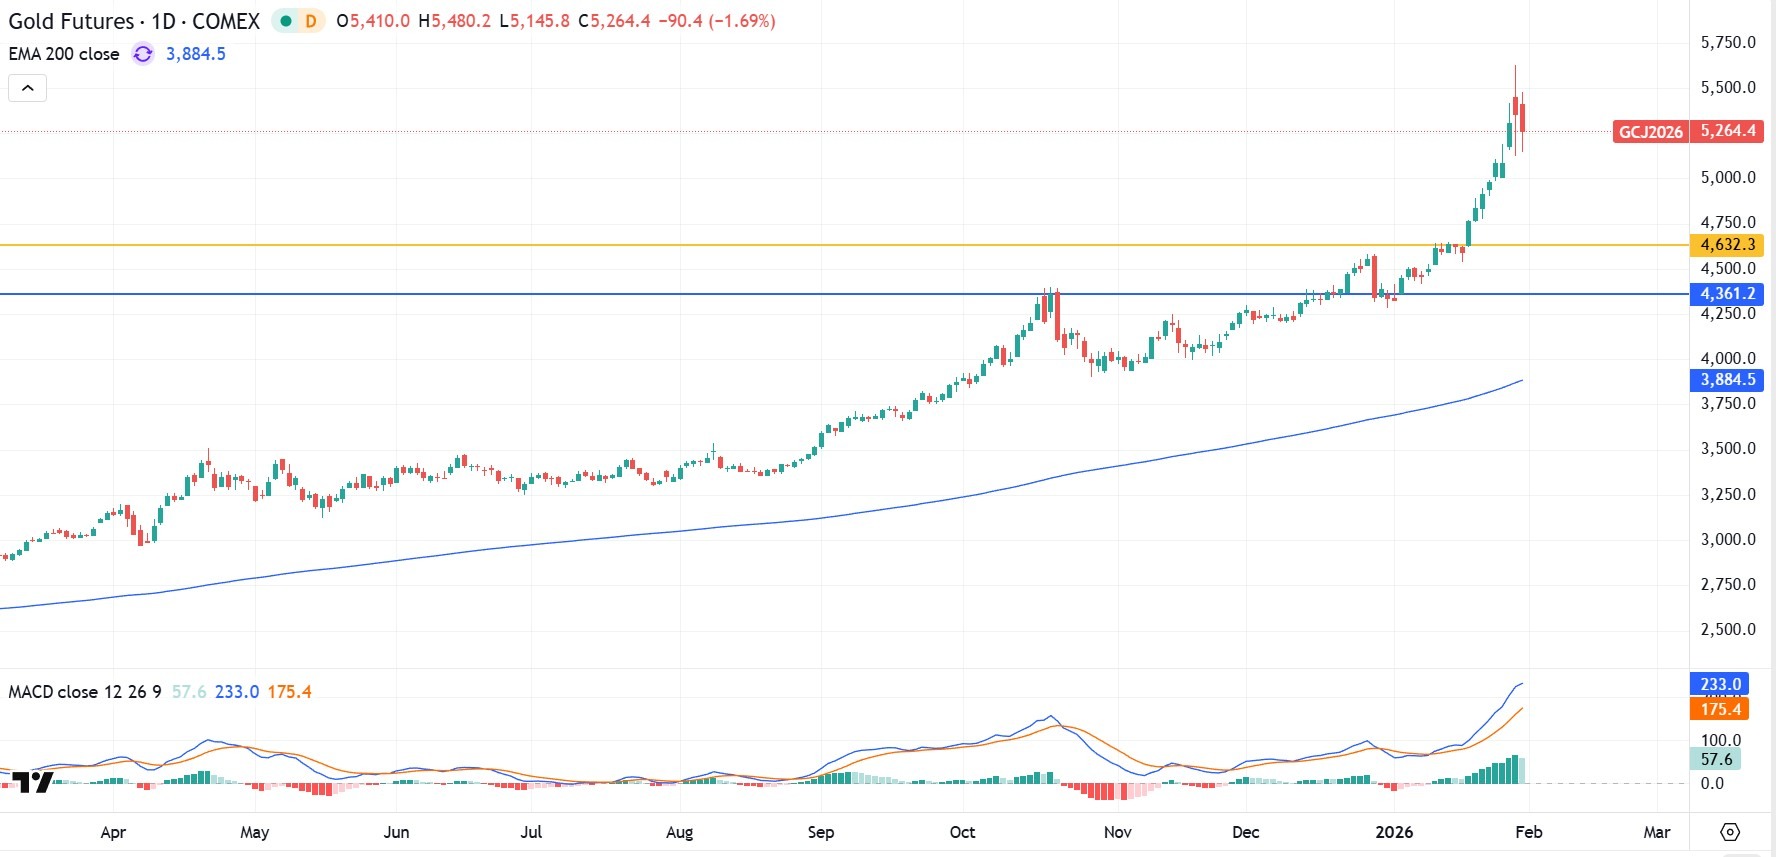
Why gold remains in focus
Gold has traded near elevated levels amid macro uncertainty and shifting rate expectations. For many traders, strength in gold is sometimes associated with defensive positioning, though gold prices can be volatile and can fall.
The US dollar, Treasury yield movements and geopolitical narrative often influence short-term direction.
Market impact
- Continued strength may suggest some investors are leaning toward defensive positioning.
- USD and sovereign yield movements often influence short-term direction.
- After a strong advance, periods of consolidation or profit-taking are common.

Disclaimer: Articles are from GO Markets analysts and contributors and are based on their independent analysis or personal experiences. Views, opinions or trading styles expressed are their own, and should not be taken as either representative of or shared by GO Markets. Advice, if any, is of a ‘general’ nature and not based on your personal objectives, financial situation or needs. Consider how appropriate the advice, if any, is to your objectives, financial situation and needs, before acting on the advice. If the advice relates to acquiring a particular financial product, you should obtain our Disclosure Statement (DS) and other legal documents available on our website for that product before making any decisions.


.jpeg)


